Why is body_mass_g not in quotes, but “Body Mass (grams)” is?
penguins |>ggplot(aes(x = body_mass_g, y = flipper_length_mm, shape = species) ) +geom_point() +labs(x ="Body Mass (grams)",y ="Flipper length (mm)")
Warm-up
Let’s introduce the kbl() function in R to control significant digits
You can do A LOT more with tables. Check the link out here
Today’s activity
– learn the difference between color and fill
– learn how to break apart a plot by another variable
– use color to our advantage
– layer geoms together
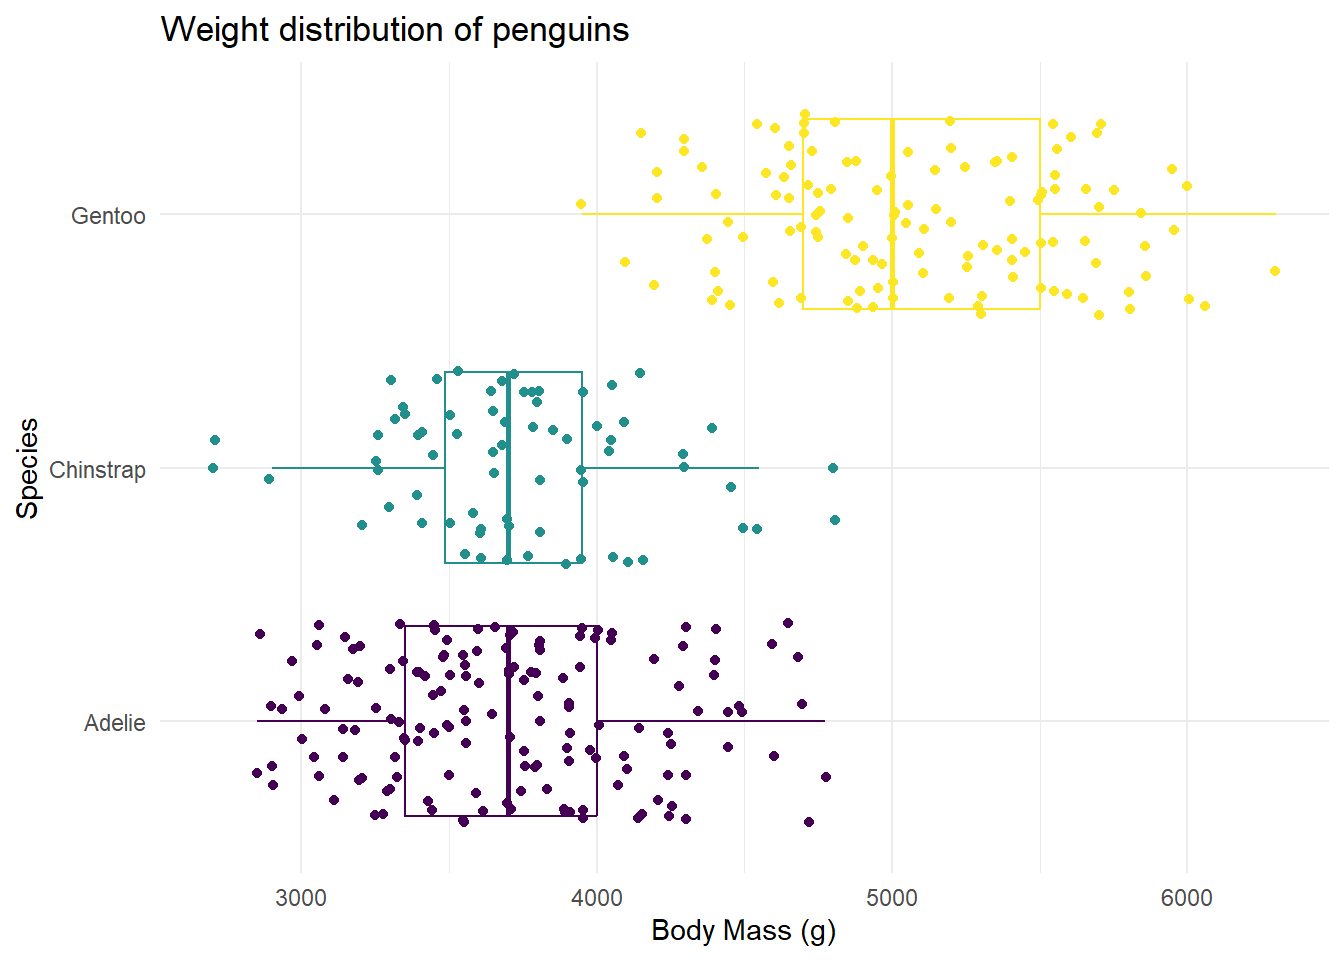
Goal
In-summary
– Color outlines geom shapes; fill fills the color in (with a scatterplot being the exception)
– We can use facet_wrap() and facet_grid() to break plots apart by variables
– We need to think about using color strategically, instead of just coloring points blue for fun. Specifically, we can think about things like color blind friendly pallets.
– We can layer on multiple geoms… and order DOES matter!