# A tibble: 3 × 2
  island    mean_bill
  <fct>         <dbl>
1 Biscoe         45.3
2 Dream          44.2
3 Torgersen      39.0
legends
What’s wrong with the following code below?
penguins |>ggplot(aes(x = bill_length_mm, y = bill_depth_mm, color = island) ) +geom_point() +labs(x ="bill length (mm)",y ="bill depth (mm)",z ="Island")
legends
To change the name of the legend, make sure that your labs() argument matches what is in your aes() function!
Warm up
Read these logical operators as a sentence:
– x <= y
– x == y
– x & y
– x | y
– is.na(x)
– x %in% y
Warm up
– x <= yx less than or equal to y
– x == yx exactly equal to y
– x & yx and y
– x | yx or y
– is.na(x)is x NA
– x %in% y x in y
== vs %in%
Change %in% to ==. What happens?
What do the following functions do?
filter()
mutate()
count()
summarise()
AE
Data are messy
Messy data
– The sheer volume of information is sometimes referred to as “messy” data, because it’s hard to make sense of it all.
Messy data
How?
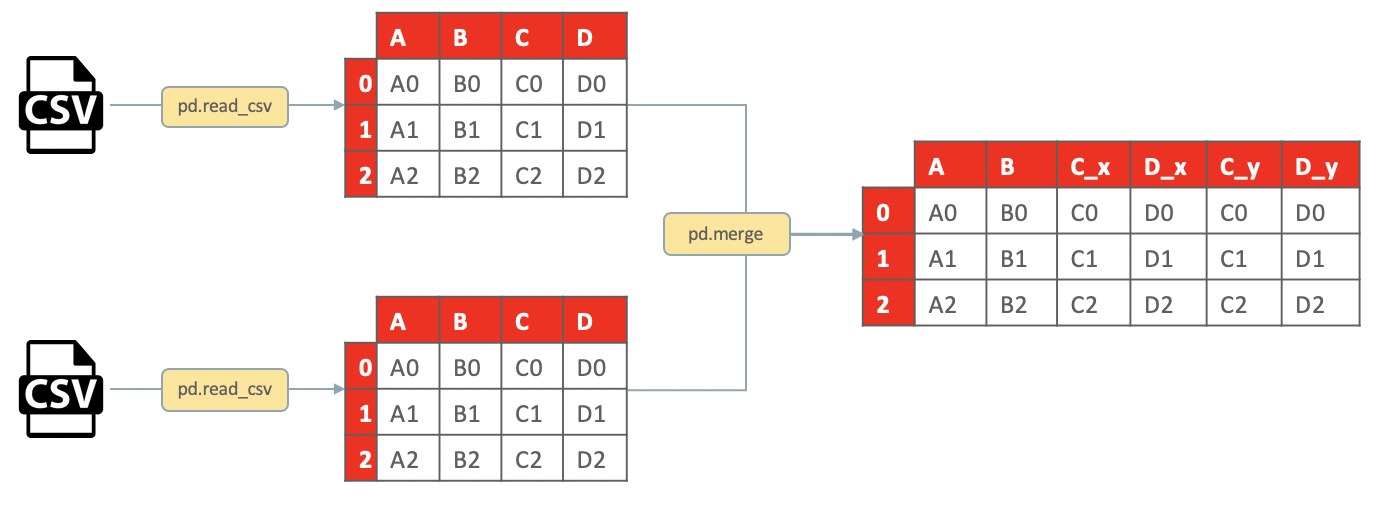
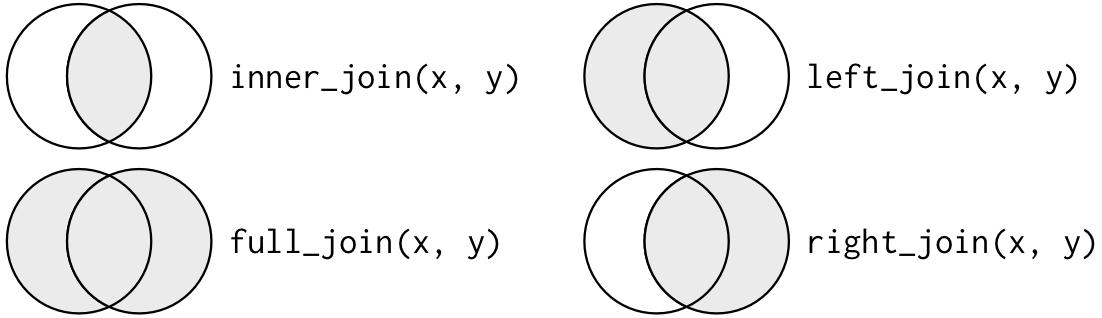
Joining datasets
Data merging is the process of combining two or more data sets into a single data set. Most often, this process is necessary when you have raw data stored in multiple files, worksheets, or data tables, that you want to analyze together.