Dates + Quarto
Lecture 17
Dr. Elijah Meyer
NC State University
ST 295 - Spring 2025
2025-03-06
Announcements
– Reagrade window for exam-1 (in-class and takehome) is open
> submit by Monday at 11:59pm
– Keys are posted
– Quiz comes out today at noon (due Monday at 11:59pm)
– Homework after Spring break
– Project instructions after Spring break
– Statistics experience is posted (Apr 22)
Goals
– work more with date data
– more Quarto functionality
– train our brain
Warm up
What’s the similarities and difference between geom_freqpoly() and geom_histogram()?
– What type of variable is needed?
– What plot is produced?
Warm up
Use geom_freqpoly() and geom_histogram() below on bill depth of the penguins data set to see the difference!
Warm up
These lines of code are used to read in date data in specific formats. What are the formats for the raw data below?
data1 <- read_csv("data/data1.csv", col_types = cols(var1 = col_date("%m/%d/%Y")))

data1 <- read_csv("data/data3.csv", col_types = cols(var1 = col_date("%y/%m/%d")))
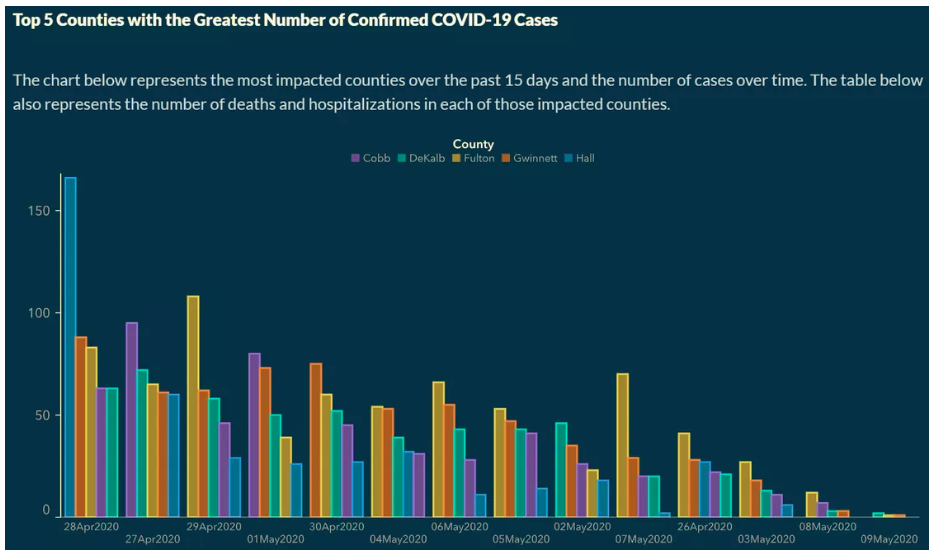
Warm up: Data literacy
What’s a general takeaway from this plot?
Is there anything that could be potentially misleading?
![]()
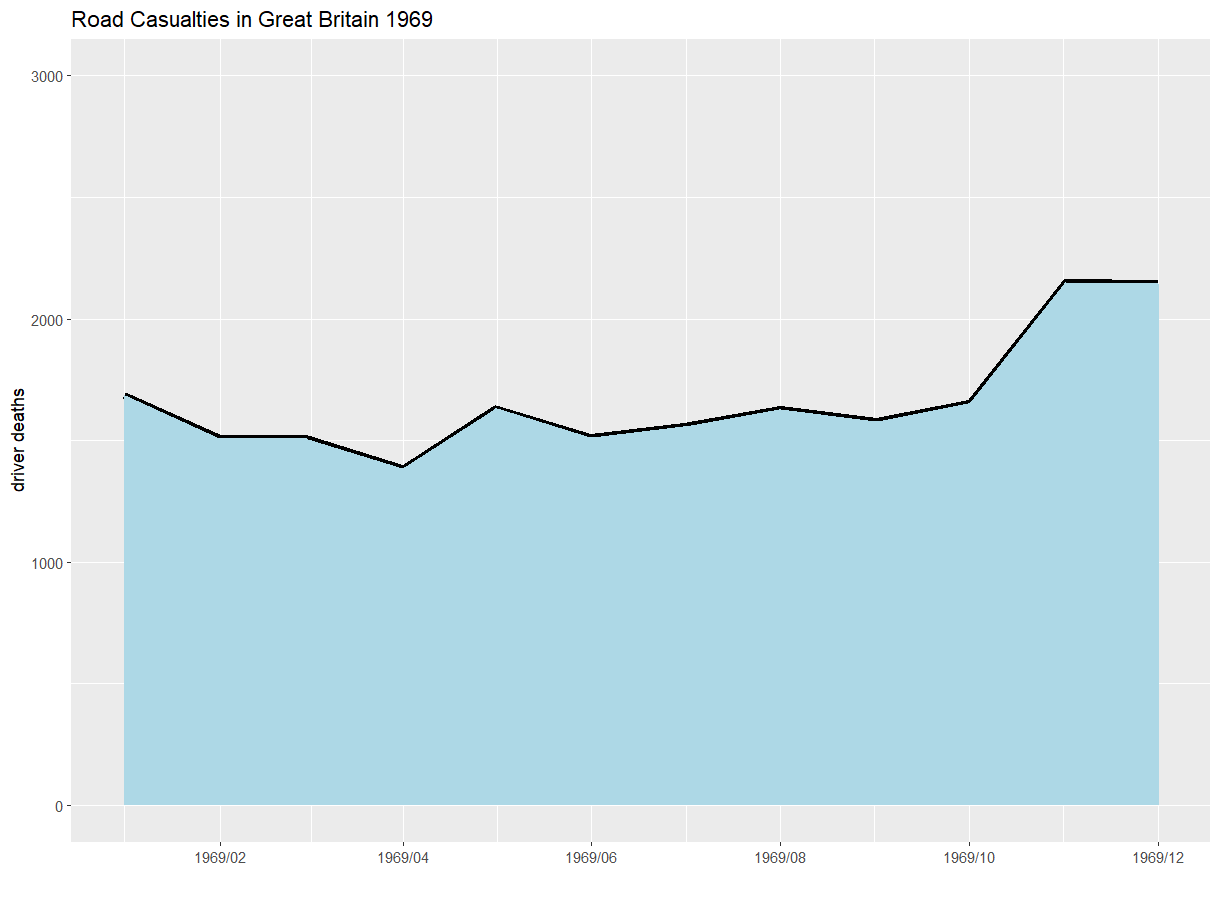
Why we use date data
– If you plot a Date on the axis of a plot, you expect the dates to be in calendar order, and that’s exactly what happens with plot() or ggplot()
– Can take advantage of functions that utilize date data types
AE
– Mess around with Quarto
– Visualize date data