Regression
Lecture 19ish
NC State University
ST 295 - Spring 2025
2025-03-25
Checklist
– Homework-3 late window ends 11:59pm tonight!
– Part-1 of your project due March 28th at 11:59pm
> I will grade this within GitHub. Turning in the project means having your final version pushed. To communicate best with me, have your last committ message say "final push" or something along those lines
– No Homework this week (please take this time to work on your project)
– Corrupted video last week…
> I posted a summary; Please reach out with any questions – Quiz Thursday (due Monday)
Where to find feedback!
Issues
GitHub Issues are a built-in, lightweight issue-tracking system within GitHub repositories, used for planning, discussing, and tracking work, including tasks, bugs, feature requests, and more.
This is where I’m going to give you feedback. Let’s walk through this process together.
Closing Issues
Learning objectives
– Understand how to summarize two quantitative variables
– What is simple linear regression (SLR)?
– How a line of best fit is made
– How to talk about the line of best fit
Warm up
Suppose I want to investigate the relationship between bill length and flipper length of penguins.
– What summary statistics could I calculate to look at each individually?
– What summary statistics could I calculate to look at their relationship?
Seperate
– mean
– median
Together: Relationship
– slope
– intercept
– correlation
Correlation
– Is bounded between [-1, 1]
– Measures the strength + direction of a linear relationship
What do I mean by linear relationship?
What do I mean by strength?
What do I mean by direction?

Guessing Game
Summary statistics
– correlation (r) ✔️
– slope + intercept (fit a line)
Fit a line
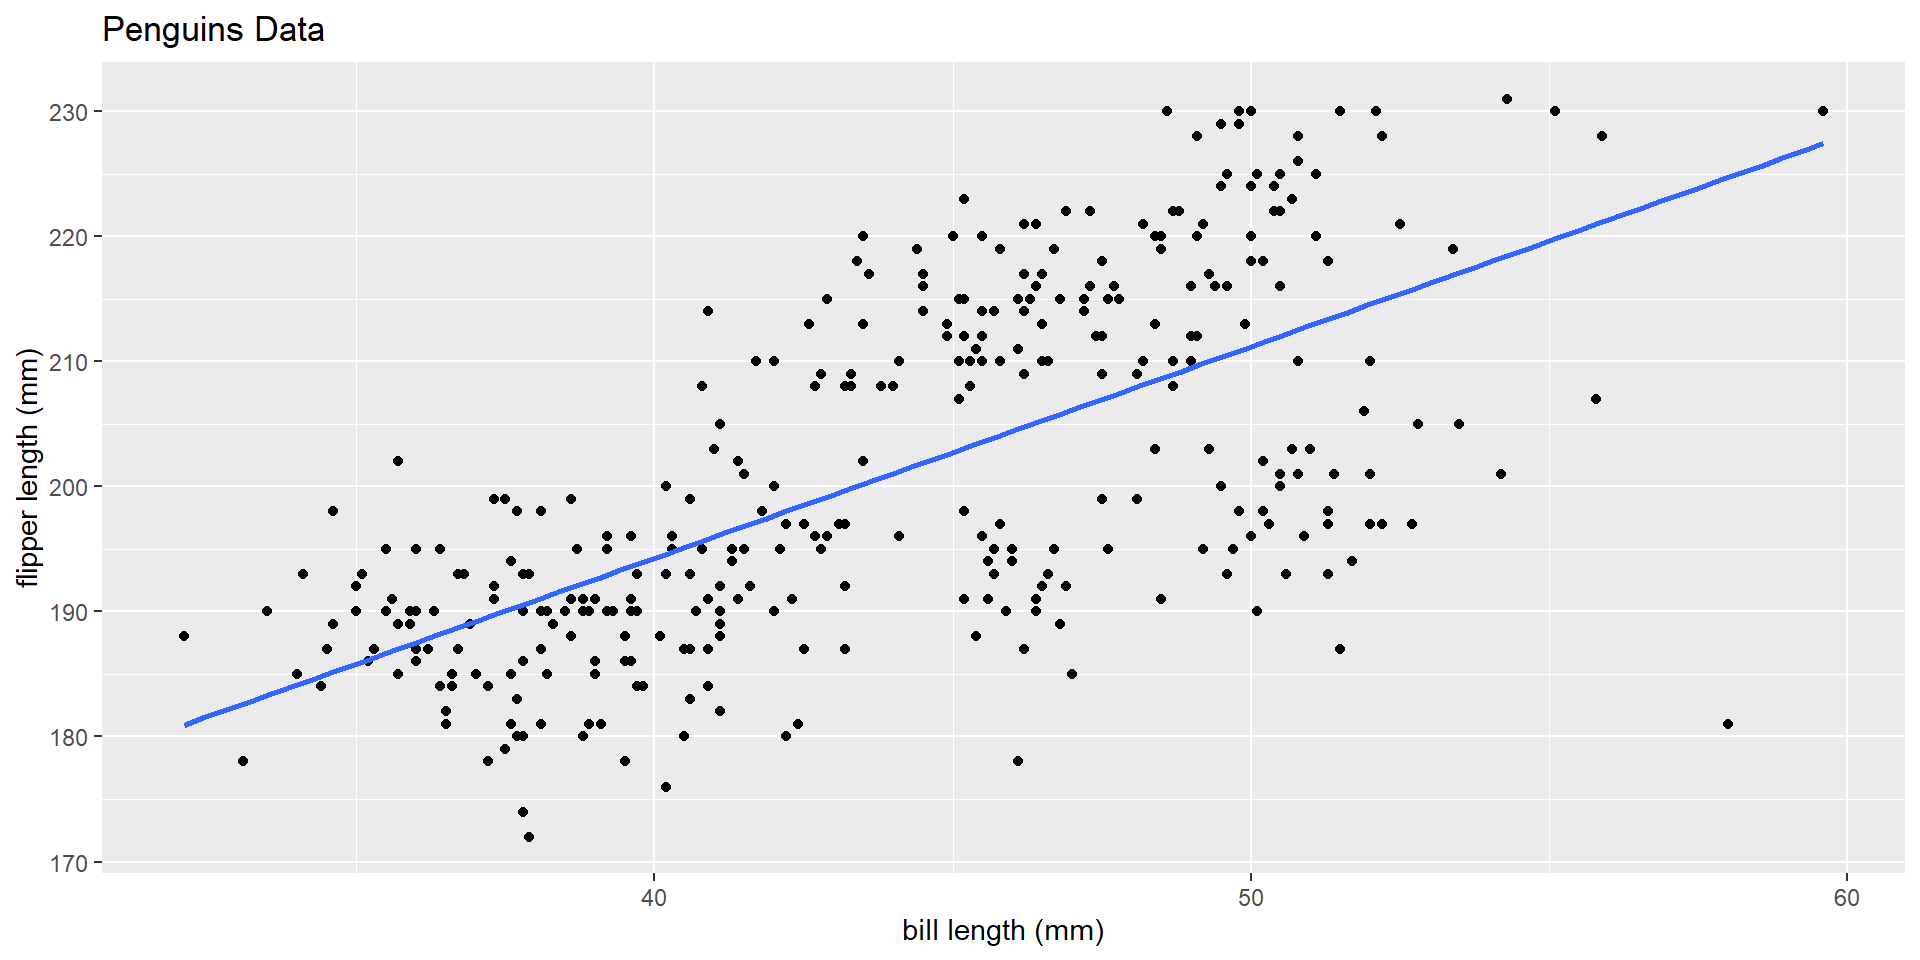
How do we suppose that this line was fit?
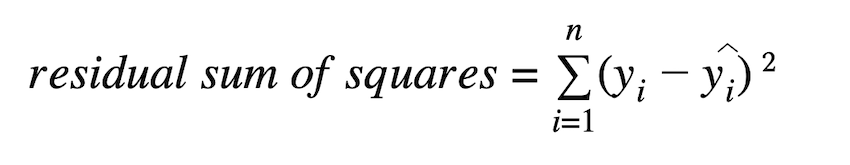
Residual
\(e_i = y - \hat{y}\)
where y is an observed value, and \(\hat{y}\) is the predicted value based on the line!
Minimize the residual sums of squares: \(\sum (y_i - \hat{y_i})^2\)
Residual
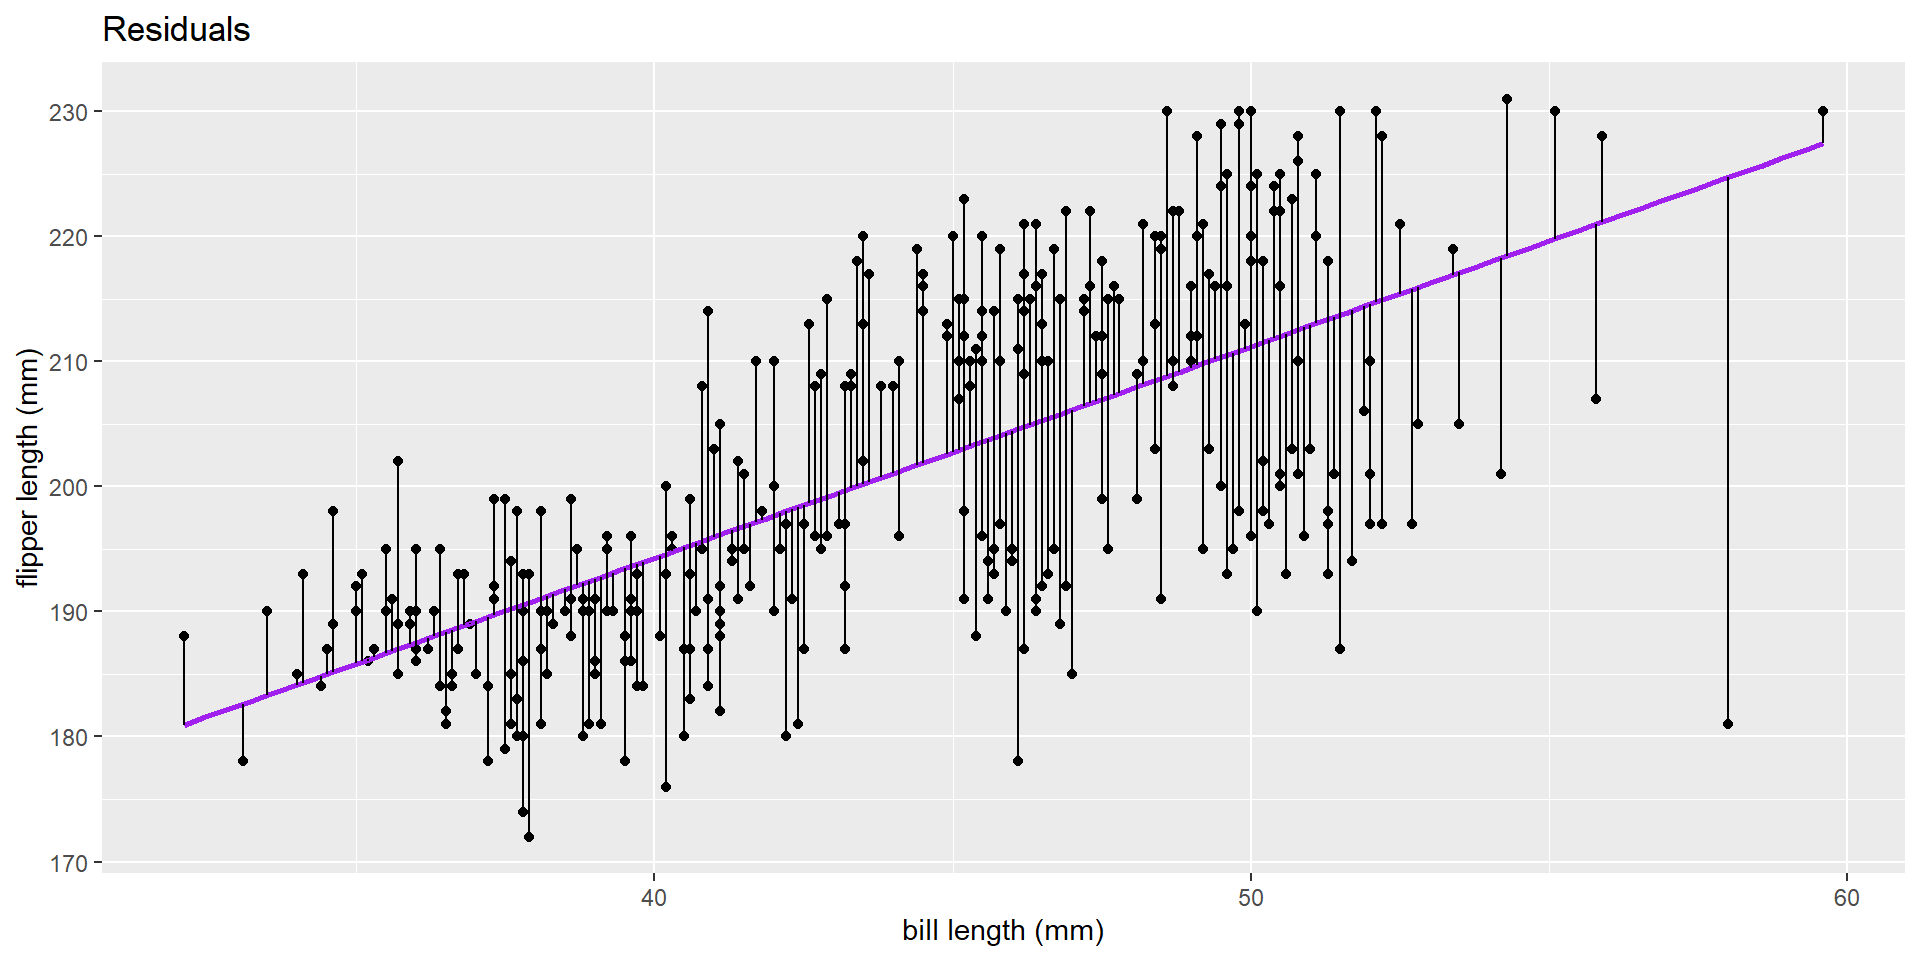
Residual Sums of Squares