| term | estimate | std.error | statistic | p.value |
|---|---|---|---|---|
| (Intercept) | -828.233 | 69.685 | -11.885 | 0 |
| height | 95.241 | 4.544 | 20.958 | 0 |
| speciesRoach | 342.665 | 41.833 | 8.191 | 0 |
Multiple Linear Regression II
Lecture 22
Dr. Elijah Meyer
NC State University
ST 295 - Spring 2025
2025-04-03
Checklist
– Homework 4 (assigned today; due Monday at 11:59pm)
– Quiz-8 (assigned Thursday; due Monday at 11:59pm)
– Draft components: For Peer Review due on April 10th
– Project feedback is live!
  > Step 1: Choose a data set
  > Step 2: Respond to issues (comment + close)
  > Step 3: Start writing and working with your data!
Project: Things to think about
Introduction + Literature Review
– Introduce your topic
  > What am I writing about?
  > Why is it important?
  > What should the reader know?
How Does an Introduction Differ from a Literature Review?
While the introduction often includes a brief overview of the important research on your topic, it should not be overly specific when discussing the literature. Instead, it also introduces your research question(s), purpose, objectives, or hypotheses.
Literature Review (Storytelling Model)
This - What’s the big picture idea of what you are trying to study
And - What is one / two aspects that we know about that big picture idea
But - What do we need to know more about
So - What is your research question.
Writing a research question
In practice, you will have much more freedom to ask/hypothesize what you are interested in. For this project, we are going to limit our methodology to what we have/are learning in class. To make sure that our RQ align with our methodology…. let’s talk about a roadmap + example research questions
Methods
– Simple Linear Regression
– Multiple Linear Regression
– Logistic Regression
Linear Regression
– Quantitative Response
– Quantitative/Categorical explanatory variable(s)
What’s the relationship between x and y?
Predicting for y given values of x
Linear Regression
Use literature + evidence to drive what else should go in your model. What should you account for? Why?
Linear Regression
What model is the “best” model for predicting values of y
> Testing and Training Data set
What model is the “best” model for explaining variability in our response (given the number of explanatory variables we use)
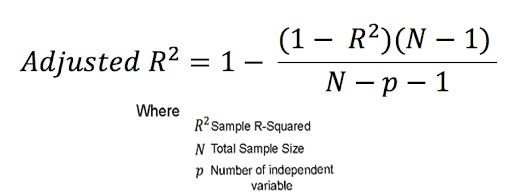
> Adjusted-R-squared
Logistic Regression
– Categorical Response
– Categorical/Quantiatitve explanatory variable(s)
What model is the “best” model for predicting values of y
> Testing and Training Data setHow does the probability of getting y change for every additional unit of x?
Questions
Warm Up
species: Bream | Roach
height: cm
weight: grams
Interpret the intercept, height, and speciesRoach coefficient.
Warm up
What assumption does an additive model put on the relationship between weight and height for each species?
AE
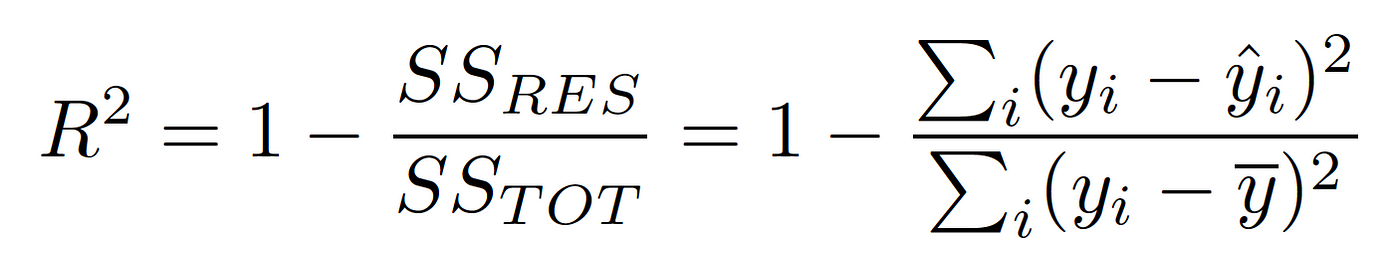
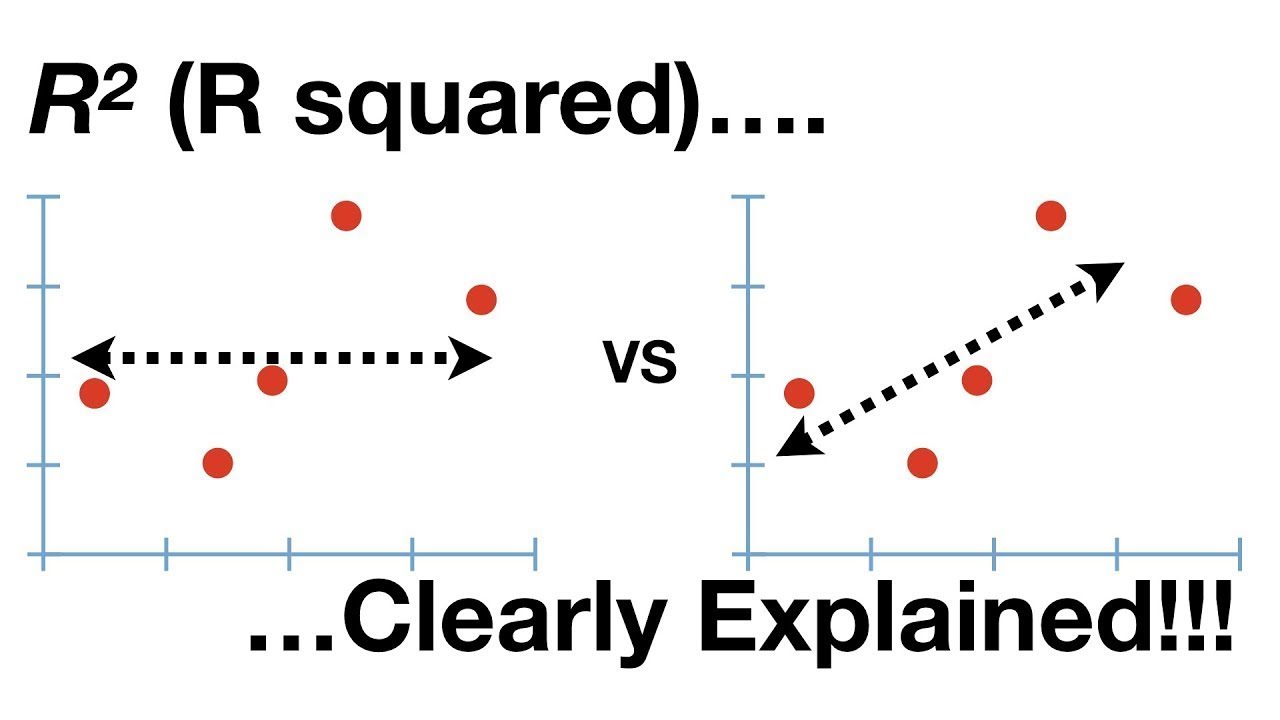
What is R-squared
Also known the coefficient of determination, it’s a common statistic used to quantify the amount of variability in y explained by our model with x(s)
Visually
Adjusted R-squared