> I will assign you a group for peer review; more to come Thursday
– No quiz this week
Workbench update
It looks like the system rebooted and the hard drive did not come up correctly so everyone that logged for your class got a new home directory created
Last time
We introduced \(R^2\) (coefficient of determination). Below is the calculation for \(R^2\) for the SLR model flipper length ~ bill length. Interpret this in the context of the problem.
library(tidyverse)library(palmerpenguins)library(tidymodels)m1 <-lm(flipper_length_mm ~ bill_length_mm, data = penguins)round(summary(m1)$r.squared, 3)
[1] 0.431
Last time
If we add species to the model, will \(R^2\) increase, decrease, or stay the same?
So…
Can we use it for model selection purposes?
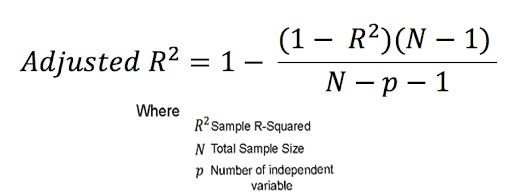
Adjusted R-squared
Evaluate based on prediction
In many situations, our goal of fitting models is to create on that is good at predicting! In order to do this, we are going to introduce the idea of testing and training data sets.
Training and Testing
Train - training data is used to train the model
Test - testing data is used to evaluate its performance
If our goal is to evaluate our model’s predictions, why is it important for us to split a full data set up into training vs testing?
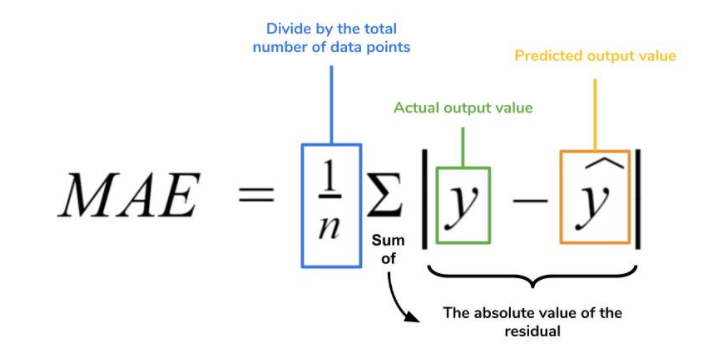
Mean Absolute Error
Mean Absolute Error (MAE) is a simple yet powerful metric used to evaluate the accuracy of regression models.
AE
Assumptions
All models have underlying assumptions that you should check for in order to trust their output. Linear regression has a few:
– Independence assumption
– Linearity assumption
– Normality assumption (more for inferential statistics)
– Constant variance (more for inferential statistics)
Independence
What does it mean to be independent?
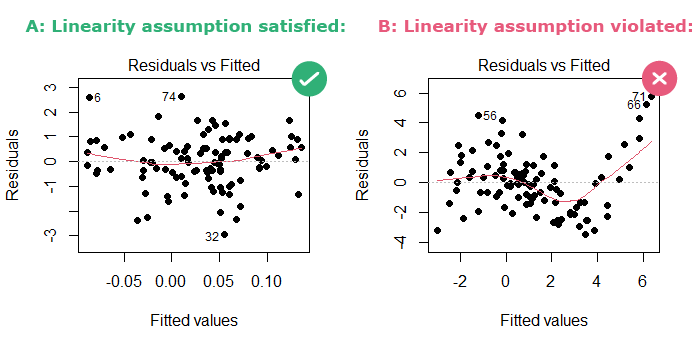
Linearity
But what if we can’t plot it? Things get messy quick
Residual vs Fitting plot
the residuals (the difference between observed and predicted values) are plotted on the y-axis and the fitted (predicted) values are on the x-axis.