(Intercept) NW.Hnd SexMale
2.1750713 0.8833640 0.1517022 Presentation Tips + Review
Lecture 27
Dr. Elijah Meyer
NC State University
ST 295 - Spring 2025
2025-04-22
Checklist
– Statistics Experience due tonight (11:59pm; no late window)
– Final exam April 24th
  > In our classroom at 8:30am

  > Heavy heavy emphasis on unit 2

  > Hand-written note sheet

  > Multiple choice; T/F; Short answer; Calculations
Formula Sheet
calculating probabilities: \(\frac{e^{\beta_o + \beta_1*x1 + \beta_2*x2 +...}}{1 + e^{\beta_o + \beta_1*x1 + \beta_2*x2 +...}}\)
log odds: \({ln}(\frac{p}{1-p})\)
residual = \(y - \hat{y}\)
Final project
– Report due April 25th at 11:59pm (I’ll restrict your push access after this time)
Report
You have detailed feedback in your issues tab
  > Please reach out if you have questions

  > Please set up a meeting if you would like to chat (just give a little notice)
Report (General Feedback)
A lot of really good work was produced. General things to consider:
– Make sure your question can/is being answered
> Prediction question vs best overall model + relationship question
Report (General Feedback)
Tell a story!
– Set the stage. Why do we care? (Introduction + Literature Review)
– What is/are your research question(s)?
– What did you do? (Methods)
– What did you find out? (EDA + Output in Results)
– Why is it interesting? (Discussion)
Report (General Feedback)
Only make something if you are going to talk about it! Everything you produce should have a purpose.
Questions?
Presentation
– Presentation due at 11:59pm turned in on Moodle
Presentation
Upload your slides to your website (Demo)
Presentation
Articulate the story of your project!
– Set the stage (why do we care)
– What is your research question(s)?
– What did you do? (doesn’t have to be everything)
– What did you find out?
– Why is it interesting?
Strategies
Slides
Bad slides can take the attention away from a good presentation. Here are some general rules:
The attention should be on what you are saying! Not the slides. That means that….
  > The slide should not be too busy

  > It should not be challenging to follow

  > You should talk about what's on your slide
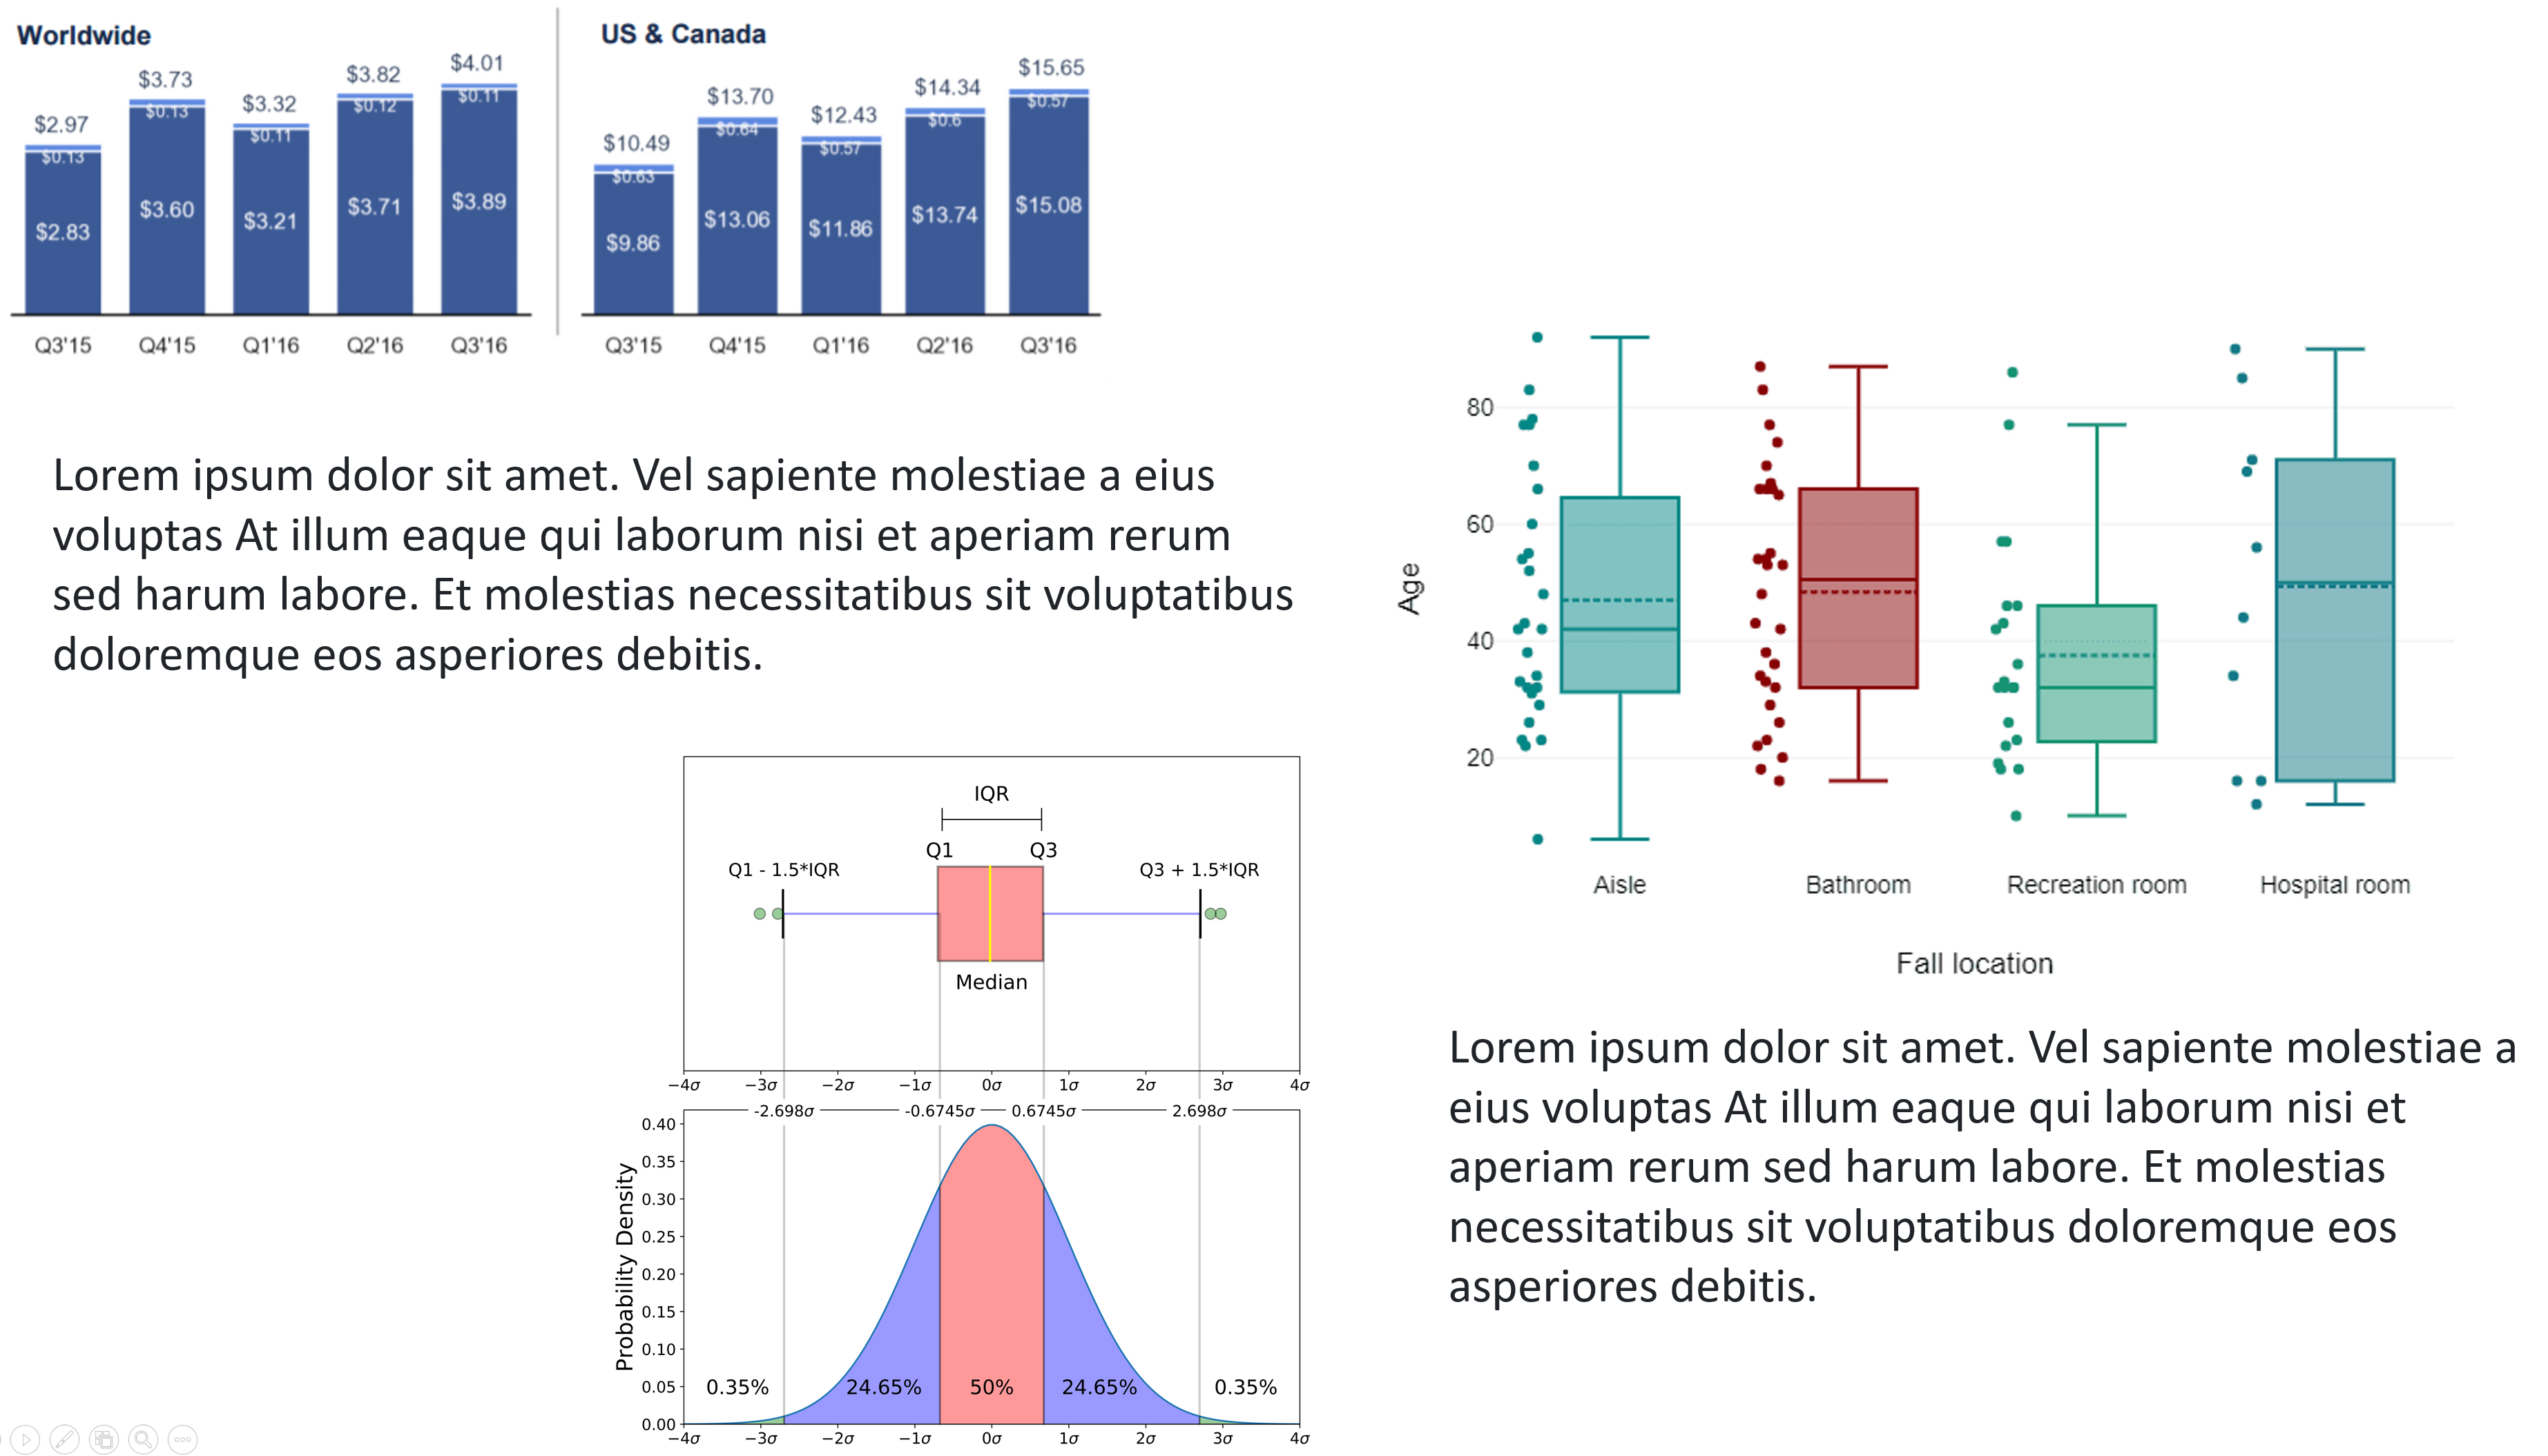
Bad slide example
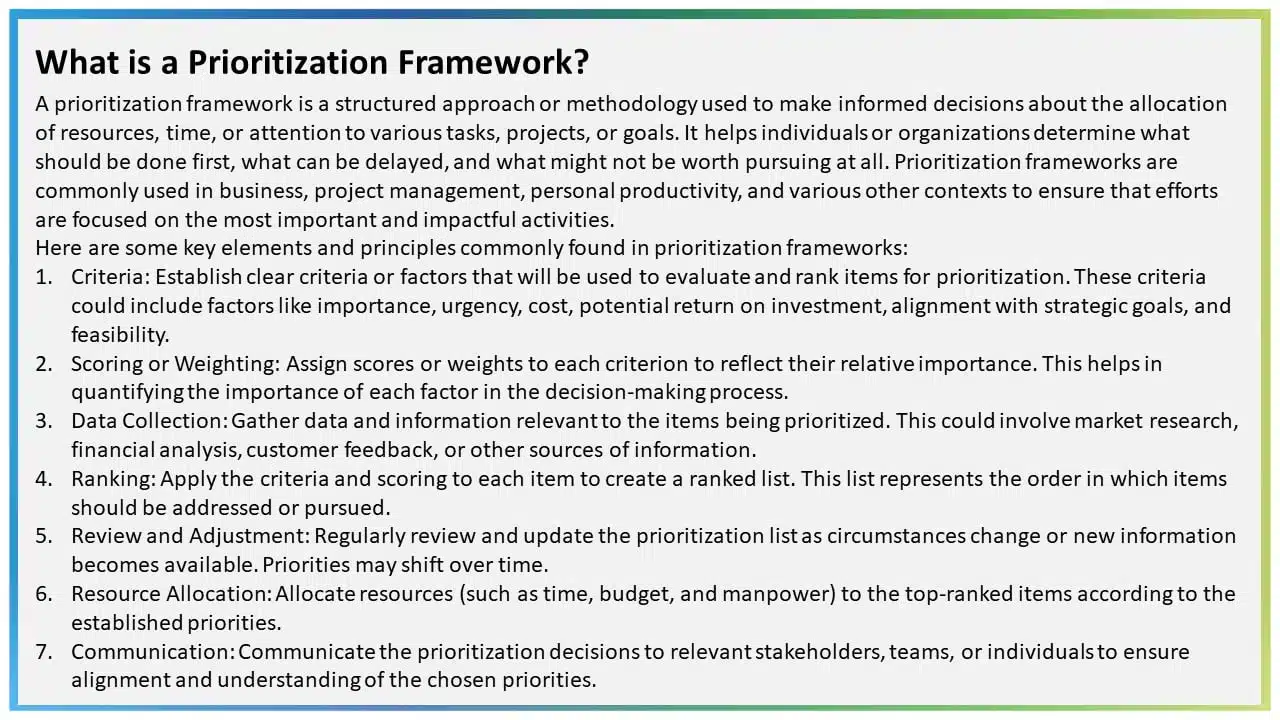
Bad slide example
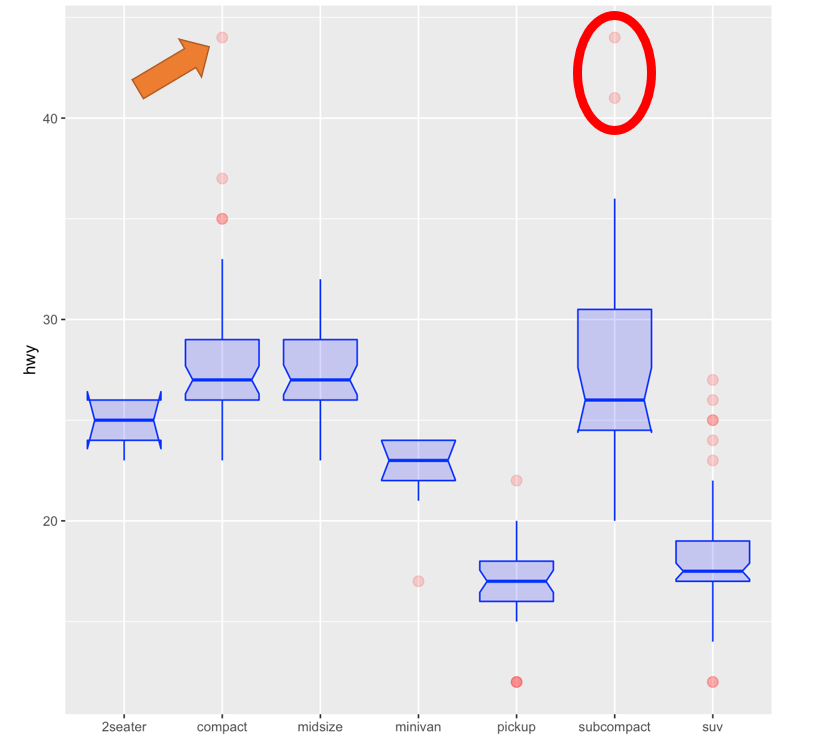
The fixes
– Make things larger than you think they need to be (this is especially important for in-person presentations)
– Make slides simple
– Guide your audience
Transitions
These should be seamless, and can be awkward…
  > Set your partner up for success

  > "And now ___ is going to talk about____"
Questions?
Review
Question 1
For this question, we are going to use the survey data set in R. This data frame contains the responses of 237 Statistics I students at the University of Adelaide to a number of questions.
We are interested in comparing the relationship between the span (measured in centimeters) of a student’s writing hand, and the span of their non-writing hand. That is, can we use the span of a student’s non-writing hand to predict the span of their writing hand?
– What are the variables? Type? Explanatory vs response?
– What method could we use to investigate this relationship?
Answers
– What are the variables? Type? Explanatory vs response?
Span of writing hand (quantitative response); Span of non-writing hand (quantitative explanatory)
Simple linear regression!
SLR
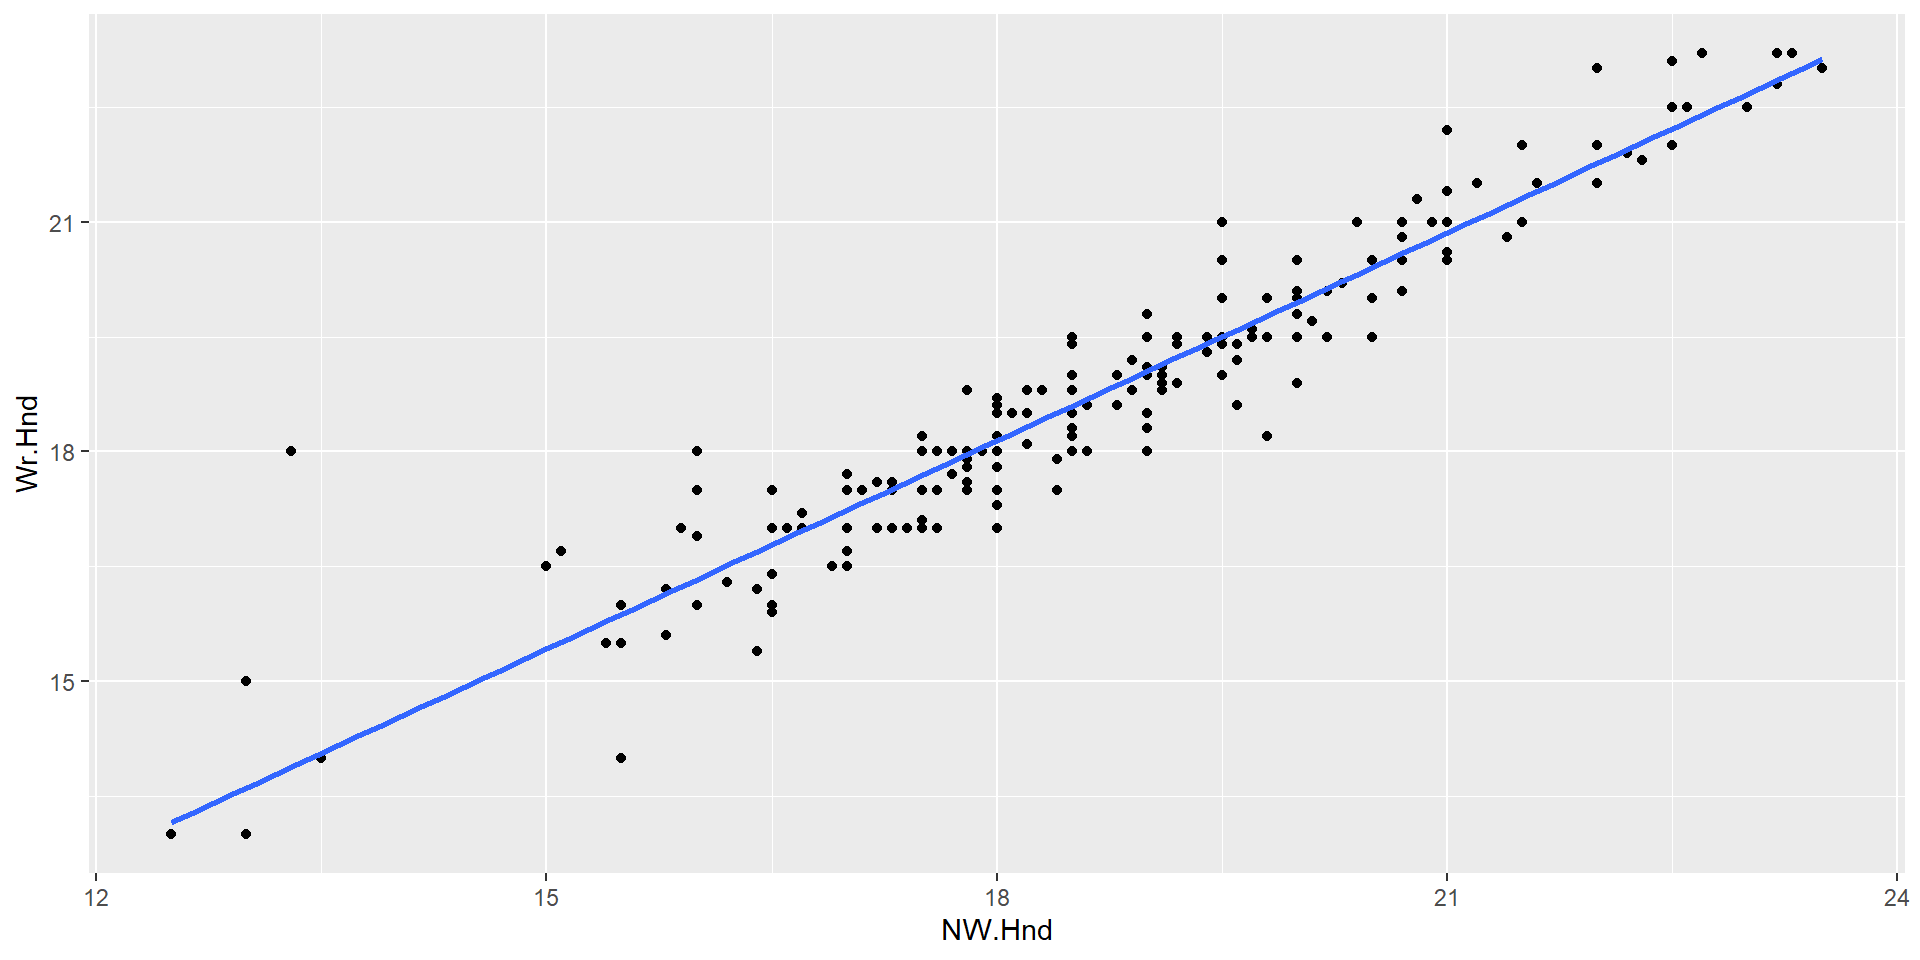
– How was this line fit?
– Describe the relationship between our 2 variables (strength + direction)
– Guess the correlation coefficient!
Answers
– How was this line fit?
Line of best fit = minimizing the residual sums of squares
– Describe the relationship between our 2 variables (strength + direction)
Strong positive relationship
– Guess the correlation coefficient!
Close to 1 (.7-1). Strong positive linear relationship between x and y
Extension
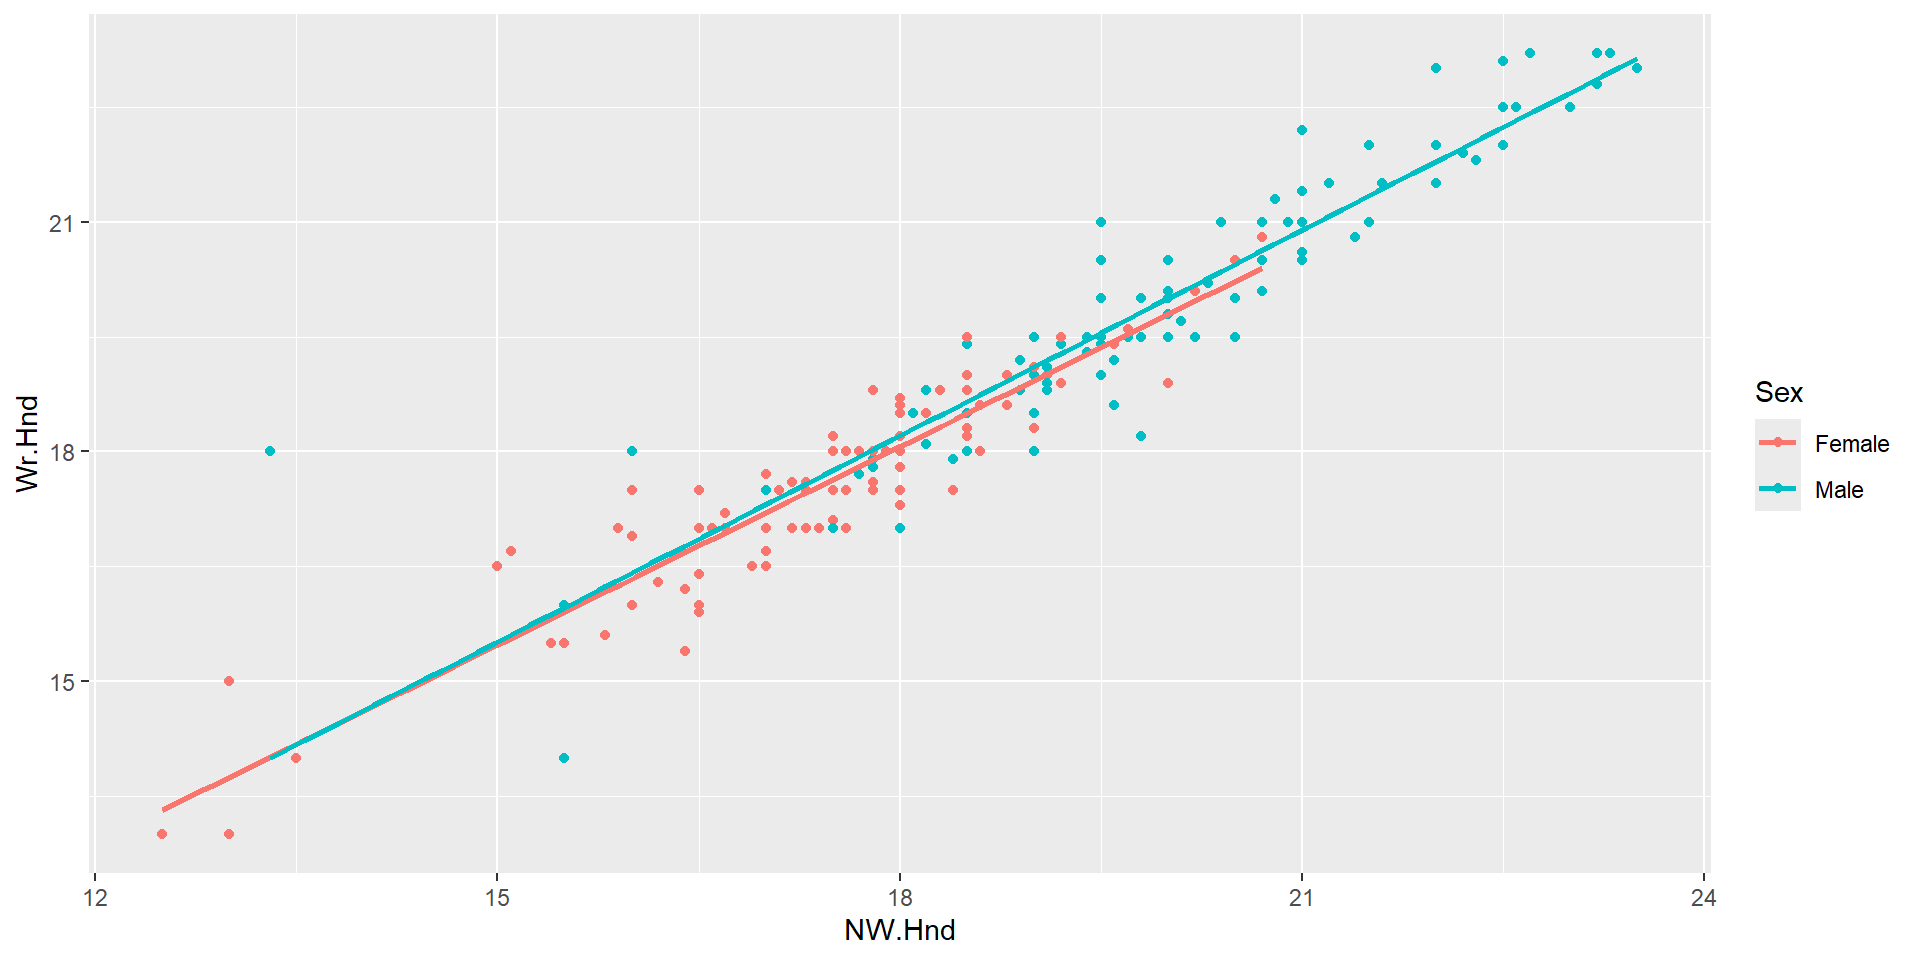
What if we wanted to compare this relationship by sex?
Based on the plot below, would you suggest fitting an additive model or an interaction model? Why?
What’s the difference between the two models?
Model
Write out the model in proper notation using the output below
Model
\(\widehat{Wr.Hnd} = 2.175 + .883*NW.Hnd + .151*Male\)
\[\begin{cases} 1 & \text{if Male level}\\ 0 & \text{else} \end{cases}\]What do these three values represent?
Question 2
For this question, we are going to use the same survey data set. Now, we are interested in predicting the probability of one’s Sex, based on which arm is on top when a student folds their hands.
     Sex           Fold
 Female:118   L on R : 98
 Male  :118   Neither: 18
              R on L :120
– What is our response variable? Explanatory variable(s)?
– Types of variables?
– Method we can use to analyze these data?
Answers
– What is our response variable? Explanatory variable?
Sex is the response; Fold is the explanatory
– Types of variables?
Sex is categorical; Fold is categorical
– Method we can use to analyze these data?
Logistic regression
Model
Note: We will consider “success” as Male.
               Estimate Std. Error    z value  Pr(>|z|)
(Intercept)  0.04082199  0.2020726  0.2020165 0.8399038
FoldNeither  0.65232519  0.5392896  1.2096010 0.2264320
FoldR on L  -0.17435339  0.2726087 -0.6395739 0.5224496
Now, write out the model in proper notation using the summary output above.
Model
\(\widehat{ln(\frac{p}{1-p}}) = 0.048 + .652*Neither - .174*RonL\)
\[\begin{cases} 1 & \text{if Neither level}\\ 0 & \text{else} \end{cases}\] \[\begin{cases} 1 & \text{if R on L level}\\ 0 & \text{else} \end{cases}\]– What do these coefficients mean?
– Calculate the estimated log odds of Neither
– Calculate the estimated probability of being a male given a student puts neither hand on top when they fold
Log odds
\(\widehat{ln(\frac{p}{1-p}}) = 0.048 + .652*1 - .174*0\)
\(\widehat{ln(\frac{p}{1-p}}) = 0.048 + .652*1\)
\(\widehat{ln(\frac{p}{1-p}}) = 0.048 + .652*1\)
\(\widehat{ln(\frac{p}{1-p}}) = 0.70\)
Probability
\(\hat{p} = \frac{e^{\widehat{\beta_o} + \widehat{\beta_1}\text{Neither}}}{1 + e^{\widehat{\beta_o} + \widehat{\beta_1}\text{Neither}}}\)
\(\hat{p} = \frac{e^.70}{1 + e^.70}\) = .668
vs the baseline
\(\hat{p} = \frac{e^{\widehat{\beta_o} + \widehat{\beta_1}\text{Neither}}}{1 + e^{\widehat{\beta_o} + \widehat{\beta_1}\text{Neither}}}\)
\(\hat{p} = \frac{e^.048}{1 + e^.048}\) = .0.512
Other topics
Model selection
  > Mean Absolute Error

  > Adjusted R-Squared

  > Sensitivity / Specificity
Why MLR instead of just SLR
> What is a confounding variable?