library(tidyverse)
library(tidymodels)
library(kableExtra)

fish <- read_csv("data/fish.csv")Modeling fish
For this application exercise, we will work with data on fish. The dataset we will use, called fish, is on two common fish species in fish market sales.
The data dictionary is below:
| variable | description |
|---|---|
species |
Species name of fish |
weight |
Weight, in grams |
length_vertical |
Vertical length, in cm |
length_diagonal |
Diagonal length, in cm |
length_cross |
Cross length, in cm |
height |
Height, in cm |
width |
Diagonal width, in cm |
Visualizing the model
We’re going to investigate the relationship between the weights and heights of fish. Specifically, we are interested in if a fish’s height helps us better understand a fish’s weight.
Define the following terms below.
Response variable: what we are trying to measure / what we are interested in (weight) - goes on the y-axis
Explanatory variable: a variable that explains/helps us understand what’s going on with our response variable (height) - goes on the x-axis
- Demo: Create an appropriate plot to investigate this relationship. Add appropriate labels to the plot, and fit a line.
fish |>
  ggplot(
    aes(x = height, y = weight)
  ) +
  geom_point() +
  geom_smooth(method = "lm", se = F)
`geom_smooth()` using formula = 'y ~ x'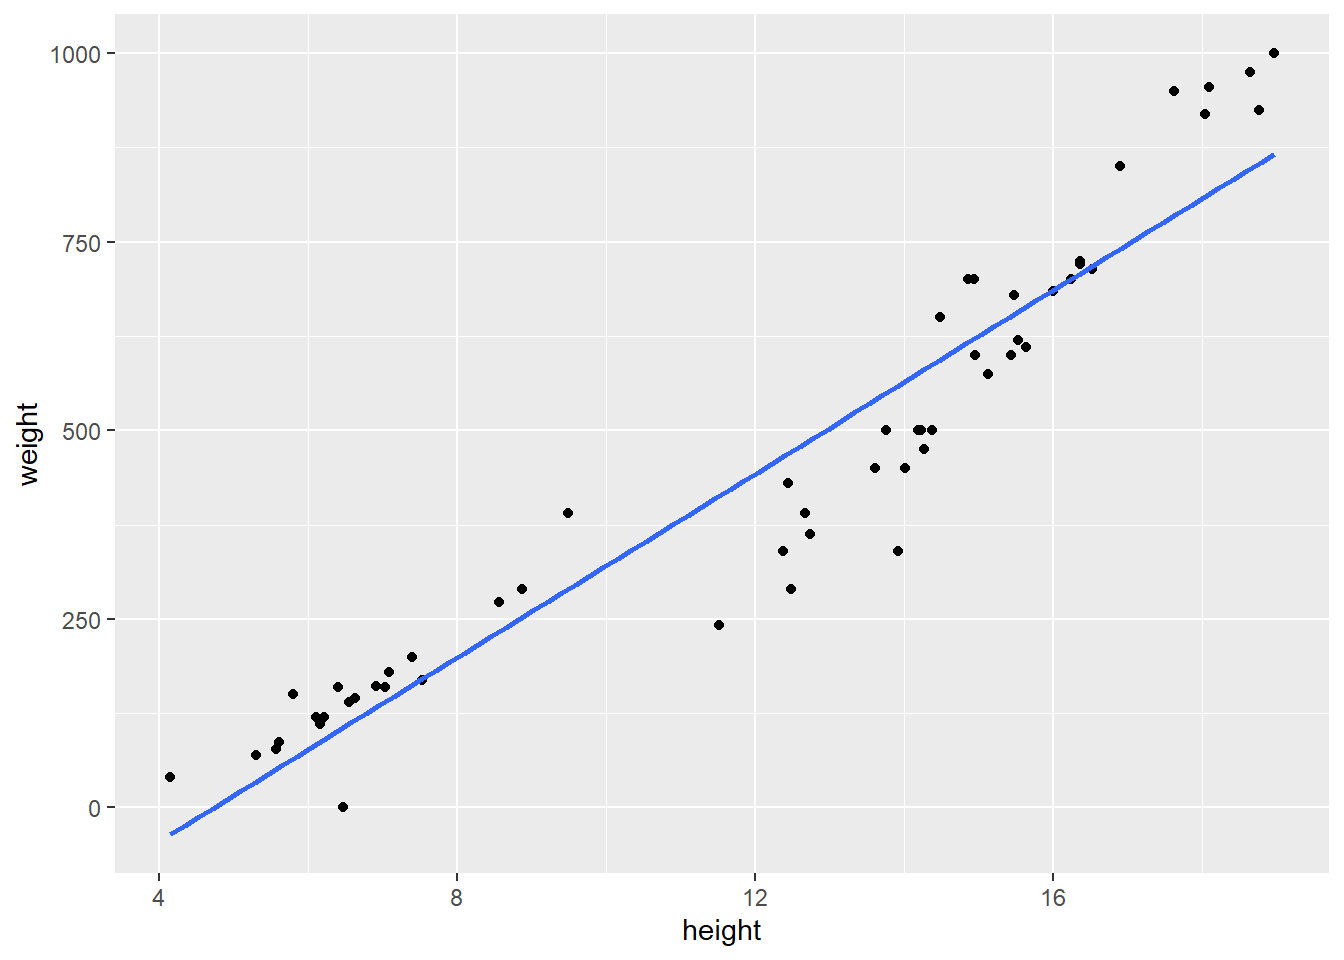
Residual
Please run the following code below:
fish_hw_fit <- linear_reg() |> # this is the model
  fit(weight ~ height, data = fish) # we will talk about this in a different question

fish_hw_aug <- augment(fish_hw_fit$fit)

ggplot(fish_hw_aug, aes(x = height, y = weight)) +
  geom_point() +
  geom_smooth(method = "lm", se = FALSE, color = "lightgrey") +
  geom_segment(aes(xend = height, yend = .fitted), color = "gray") +
  geom_point(aes(y = .fitted), shape = "circle open") +
  theme_minimal() +
  labs(
    title = "Weights vs. heights of fish",
    subtitle = "Residuals",
    x = "Height (cm)",
    y = "Weight (gr)"
  )
`geom_smooth()` using formula = 'y ~ x'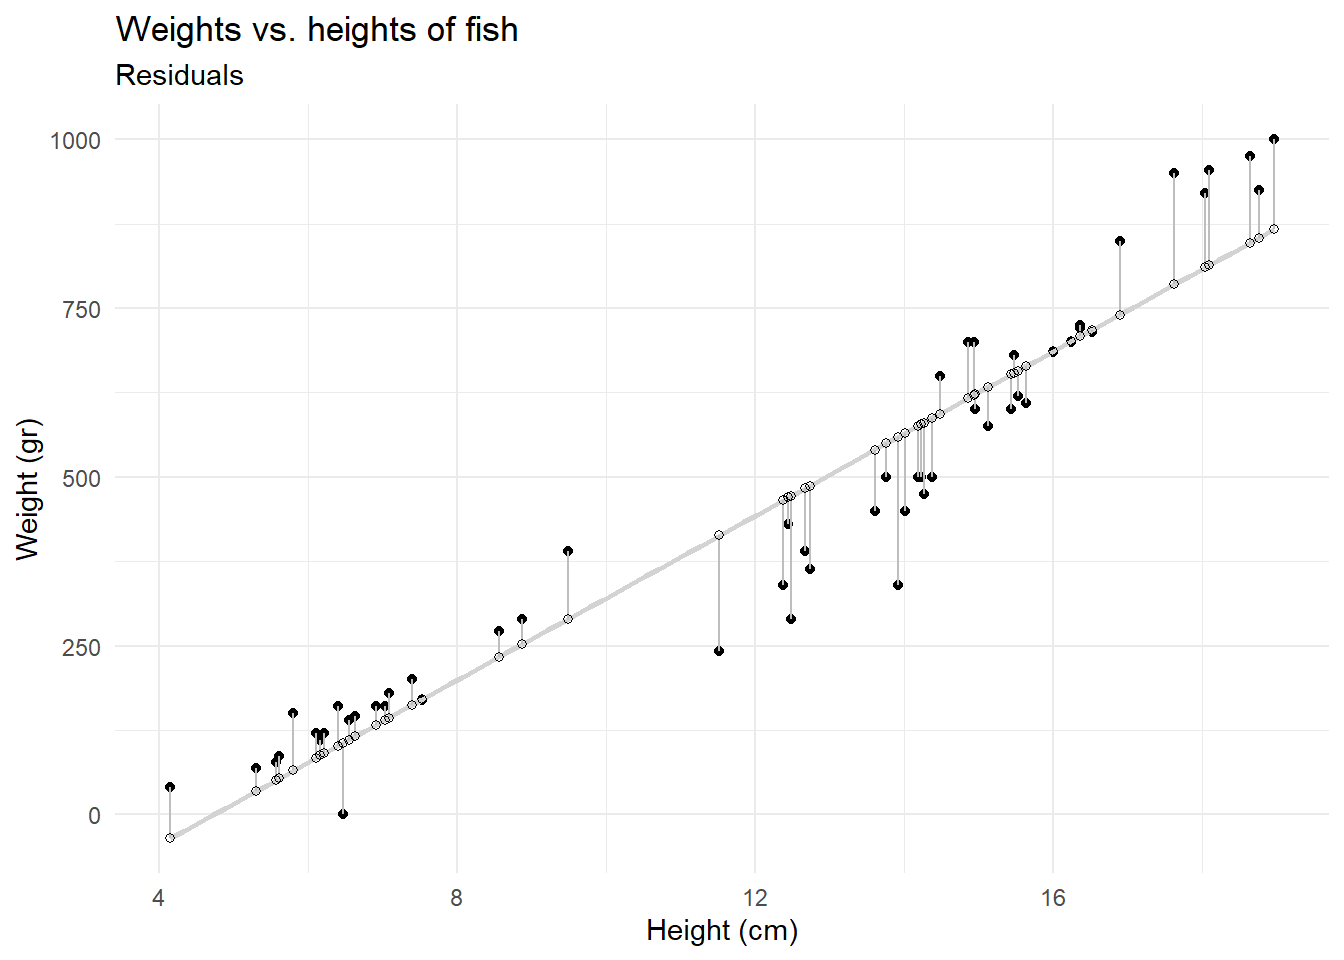
Practice: Using technical terms, how is R picking the “best line” to fit?
minimizes the residual sums of squares (RSS)
-
What types of questions can this plot help answer?
*1. Prediction: For a given height, what's my predicted weight?*
*2. Relationship: What is the relationship between height and weight?*
Model fitting
- Demo: Fit a model to predict fish weights from their heights. Comment the code below.
fish_hw_fit <- linear_reg() |> # tell R that I want to do linear regression
  fit(weight ~ height, data = fish) # y ~ x, data =
Model summary
-
Demo: Display the model summary. Next, show how you can extract these values from the model output. Hint: pull up the help file
pull().