── Attaching core tidyverse packages ──────────────────────── tidyverse 2.0.0 ──
✔ dplyr     1.1.4     ✔ readr     2.1.5
✔ forcats   1.0.0     ✔ stringr   1.5.1
✔ ggplot2   3.5.1     ✔ tibble    3.2.1
✔ lubridate 1.9.3     ✔ tidyr     1.3.1
✔ purrr     1.0.2
── Conflicts ────────────────────────────────────────── tidyverse_conflicts() ──
✖ dplyr::filter() masks stats::filter()
✖ dplyr::lag()    masks stats::lag()
ℹ Use the conflicted package (<http://conflicted.r-lib.org/>) to force all conflicts to become errorsReview + Extensions Solutions
if_else vs case_when practice
Pull up the help files for if_else vs case_when. What’s the difference?
if else works on a TRUE FALSE condition. case when is more flexible.
We are going to practice on the mtcars dataset. Refresh your memory by pulling up the help file for mtcars.
We notice that the am variable is not very informative, coding 0 and 1. Let’s change the values to be more descriptive! Should we use if_else or case_when?
if else! We have a TRUE FALSE condition.
Now, make a new variable called am_cat that has “automatic” for the value of 0, and “manual” for the value of 1.
                     mpg cyl  disp  hp drat    wt  qsec vs am gear carb
Mazda RX4           21.0   6 160.0 110 3.90 2.620 16.46  0  1    4    4
Mazda RX4 Wag       21.0   6 160.0 110 3.90 2.875 17.02  0  1    4    4
Datsun 710          22.8   4 108.0  93 3.85 2.320 18.61  1  1    4    1
Hornet 4 Drive      21.4   6 258.0 110 3.08 3.215 19.44  1  0    3    1
Hornet Sportabout   18.7   8 360.0 175 3.15 3.440 17.02  0  0    3    2
Valiant             18.1   6 225.0 105 2.76 3.460 20.22  1  0    3    1
Duster 360          14.3   8 360.0 245 3.21 3.570 15.84  0  0    3    4
Merc 240D           24.4   4 146.7  62 3.69 3.190 20.00  1  0    4    2
Merc 230            22.8   4 140.8  95 3.92 3.150 22.90  1  0    4    2
Merc 280            19.2   6 167.6 123 3.92 3.440 18.30  1  0    4    4
Merc 280C           17.8   6 167.6 123 3.92 3.440 18.90  1  0    4    4
Merc 450SE          16.4   8 275.8 180 3.07 4.070 17.40  0  0    3    3
Merc 450SL          17.3   8 275.8 180 3.07 3.730 17.60  0  0    3    3
Merc 450SLC         15.2   8 275.8 180 3.07 3.780 18.00  0  0    3    3
Cadillac Fleetwood  10.4   8 472.0 205 2.93 5.250 17.98  0  0    3    4
Lincoln Continental 10.4   8 460.0 215 3.00 5.424 17.82  0  0    3    4
Chrysler Imperial   14.7   8 440.0 230 3.23 5.345 17.42  0  0    3    4
Fiat 128            32.4   4  78.7  66 4.08 2.200 19.47  1  1    4    1
Honda Civic         30.4   4  75.7  52 4.93 1.615 18.52  1  1    4    2
Toyota Corolla      33.9   4  71.1  65 4.22 1.835 19.90  1  1    4    1
Toyota Corona       21.5   4 120.1  97 3.70 2.465 20.01  1  0    3    1
Dodge Challenger    15.5   8 318.0 150 2.76 3.520 16.87  0  0    3    2
AMC Javelin         15.2   8 304.0 150 3.15 3.435 17.30  0  0    3    2
Camaro Z28          13.3   8 350.0 245 3.73 3.840 15.41  0  0    3    4
Pontiac Firebird    19.2   8 400.0 175 3.08 3.845 17.05  0  0    3    2
Fiat X1-9           27.3   4  79.0  66 4.08 1.935 18.90  1  1    4    1
Porsche 914-2       26.0   4 120.3  91 4.43 2.140 16.70  0  1    5    2
Lotus Europa        30.4   4  95.1 113 3.77 1.513 16.90  1  1    5    2
Ford Pantera L      15.8   8 351.0 264 4.22 3.170 14.50  0  1    5    4
Ferrari Dino        19.7   6 145.0 175 3.62 2.770 15.50  0  1    5    6
Maserati Bora       15.0   8 301.0 335 3.54 3.570 14.60  0  1    5    8
Volvo 142E          21.4   4 121.0 109 4.11 2.780 18.60  1  1    4    2
                       am_cat
Mazda RX4              manuel
Mazda RX4 Wag          manuel
Datsun 710             manuel
Hornet 4 Drive      automatic
Hornet Sportabout   automatic
Valiant             automatic
Duster 360          automatic
Merc 240D           automatic
Merc 230            automatic
Merc 280            automatic
Merc 280C           automatic
Merc 450SE          automatic
Merc 450SL          automatic
Merc 450SLC         automatic
Cadillac Fleetwood  automatic
Lincoln Continental automatic
Chrysler Imperial   automatic
Fiat 128               manuel
Honda Civic            manuel
Toyota Corolla         manuel
Toyota Corona       automatic
Dodge Challenger    automatic
AMC Javelin         automatic
Camaro Z28          automatic
Pontiac Firebird    automatic
Fiat X1-9              manuel
Porsche 914-2          manuel
Lotus Europa           manuel
Ford Pantera L         manuel
Ferrari Dino           manuel
Maserati Bora          manuel
Volvo 142E             manuel
Now, suppose we want to change qsec to qsec_cat. Specifically, we want to categorize weight by slow (< 17), mid (> 17, < 20), and fast (> 20).
                     mpg cyl  disp  hp drat    wt  qsec vs am gear carb
Mazda RX4           21.0   6 160.0 110 3.90 2.620 16.46  0  1    4    4
Mazda RX4 Wag       21.0   6 160.0 110 3.90 2.875 17.02  0  1    4    4
Datsun 710          22.8   4 108.0  93 3.85 2.320 18.61  1  1    4    1
Hornet 4 Drive      21.4   6 258.0 110 3.08 3.215 19.44  1  0    3    1
Hornet Sportabout   18.7   8 360.0 175 3.15 3.440 17.02  0  0    3    2
Valiant             18.1   6 225.0 105 2.76 3.460 20.22  1  0    3    1
Duster 360          14.3   8 360.0 245 3.21 3.570 15.84  0  0    3    4
Merc 240D           24.4   4 146.7  62 3.69 3.190 20.00  1  0    4    2
Merc 230            22.8   4 140.8  95 3.92 3.150 22.90  1  0    4    2
Merc 280            19.2   6 167.6 123 3.92 3.440 18.30  1  0    4    4
Merc 280C           17.8   6 167.6 123 3.92 3.440 18.90  1  0    4    4
Merc 450SE          16.4   8 275.8 180 3.07 4.070 17.40  0  0    3    3
Merc 450SL          17.3   8 275.8 180 3.07 3.730 17.60  0  0    3    3
Merc 450SLC         15.2   8 275.8 180 3.07 3.780 18.00  0  0    3    3
Cadillac Fleetwood  10.4   8 472.0 205 2.93 5.250 17.98  0  0    3    4
Lincoln Continental 10.4   8 460.0 215 3.00 5.424 17.82  0  0    3    4
Chrysler Imperial   14.7   8 440.0 230 3.23 5.345 17.42  0  0    3    4
Fiat 128            32.4   4  78.7  66 4.08 2.200 19.47  1  1    4    1
Honda Civic         30.4   4  75.7  52 4.93 1.615 18.52  1  1    4    2
Toyota Corolla      33.9   4  71.1  65 4.22 1.835 19.90  1  1    4    1
Toyota Corona       21.5   4 120.1  97 3.70 2.465 20.01  1  0    3    1
Dodge Challenger    15.5   8 318.0 150 2.76 3.520 16.87  0  0    3    2
AMC Javelin         15.2   8 304.0 150 3.15 3.435 17.30  0  0    3    2
Camaro Z28          13.3   8 350.0 245 3.73 3.840 15.41  0  0    3    4
Pontiac Firebird    19.2   8 400.0 175 3.08 3.845 17.05  0  0    3    2
Fiat X1-9           27.3   4  79.0  66 4.08 1.935 18.90  1  1    4    1
Porsche 914-2       26.0   4 120.3  91 4.43 2.140 16.70  0  1    5    2
Lotus Europa        30.4   4  95.1 113 3.77 1.513 16.90  1  1    5    2
Ford Pantera L      15.8   8 351.0 264 4.22 3.170 14.50  0  1    5    4
Ferrari Dino        19.7   6 145.0 175 3.62 2.770 15.50  0  1    5    6
Maserati Bora       15.0   8 301.0 335 3.54 3.570 14.60  0  1    5    8
Volvo 142E          21.4   4 121.0 109 4.11 2.780 18.60  1  1    4    2
                    qsec_cat
Mazda RX4               slow
Mazda RX4 Wag            mid
Datsun 710               mid
Hornet 4 Drive           mid
Hornet Sportabout        mid
Valiant                 fast
Duster 360              slow
Merc 240D               fast
Merc 230                fast
Merc 280                 mid
Merc 280C                mid
Merc 450SE               mid
Merc 450SL               mid
Merc 450SLC              mid
Cadillac Fleetwood       mid
Lincoln Continental      mid
Chrysler Imperial        mid
Fiat 128                 mid
Honda Civic              mid
Toyota Corolla           mid
Toyota Corona           fast
Dodge Challenger        slow
AMC Javelin              mid
Camaro Z28              slow
Pontiac Firebird         mid
Fiat X1-9                mid
Porsche 914-2           slow
Lotus Europa            slow
Ford Pantera L          slow
Ferrari Dino            slow
Maserati Bora           slow
Volvo 142E               mid
What happens if you don’t have a case condition for a value in your data set?
it produces a NA value!
Recreate the plot seen in the slides!
Making this plot covers things that we have already covered, and combines them with new tidyverse geoms for us to learn!
peng_summary <- penguins |>
  group_by(species, sex) |>
  filter(!is.na(sex)) |>
  summarise(med = median(bill_length_mm)) |>
  mutate(med_label = as.character(med))
`summarise()` has grouped output by 'species'. You can override using the
`.groups` argument.penguins |>
filter(!is.na(sex)) |>
ggplot(
aes(bill_length_mm, fill = species)
) +
geom_histogram() +
facet_grid(species ~ sex) +
geom_vline(data = peng_summary, aes(xintercept = med), linetype = "dashed") +
geom_text(data = peng_summary, aes(x = med + 3, y = 15, label = med_label), size = 5) +
labs(x = "bill length (mm)",
y = "count",
title = "bill length by sex and species") +
theme(legend.position = "none")`stat_bin()` using `bins = 30`. Pick better value with `binwidth`.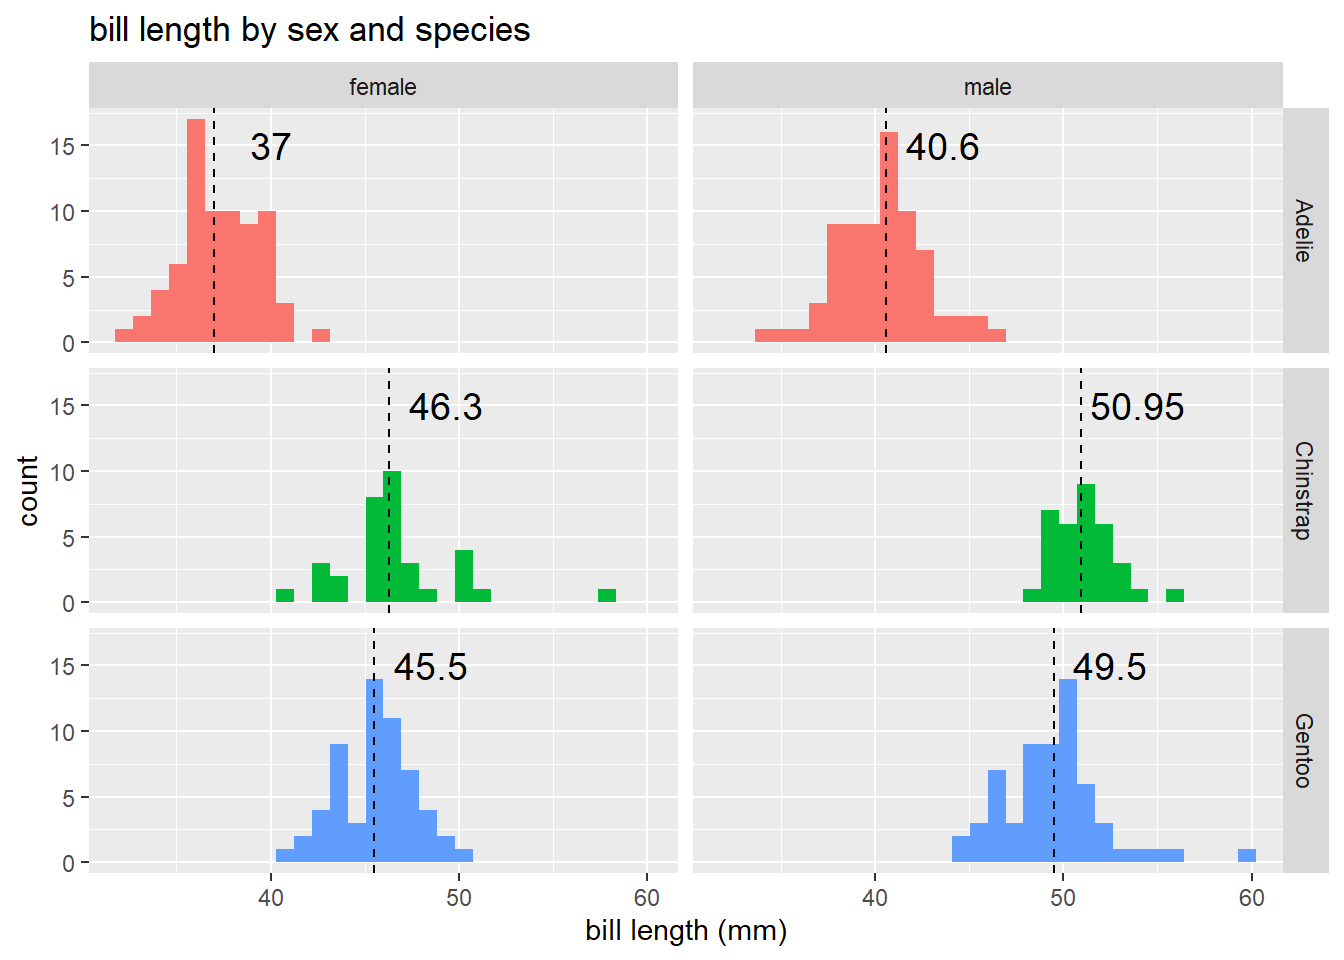
Takeaway! You can work with multiple data sets when plotting + introduce geom_vline and geom_text