Exam-1: Solutions
Packages
Question 1
GitHub is an online software development platform. It’s used for storing, tracking, and collaborating on software projects. In STA199, we have used GitHub and developed a working system with GitHub for AEs, homework, labs thus far. Below, please answer the following questions about GitHub? Be as detailed as possible.
a What does the git push command do?
pushes local changes up to the respective GitHub repo
b What does the git pull command do?
pulls most recent files on your GitHub repo down to your local compter
c What does the git commit command do?
commit acts as a “save”, prepare changes to be pushed
Question 2
In detail, identify what the error is AND explain to them how they could fix their errors in the code to create a scatterplot between petal length and petal width with the points colored by species. Hint: There are 3 errors in the code above that need to be fixed to create the following plot. You do not need to report the code. You do need to report the error and, in detail, explain what the error is and how it can be fixed.
Iris |>
  ggplot(
    x = Petal.Length, y = Petal.Width
  ) +
  geom_point(color = "Species")

iris |>
  ggplot(
    aes(x = Petal.Length, y = Petal.Width, color = Species)
  ) +
  geom_point()
Error 1 Iris needs to be lowercase
Error 2 Missing aes() function
Error 3 color = Species needs to be in the aes() function (fill also needs to be color)
Error 4 Species does not need quotes
Question 3
Using the Batting data set in the Lahman package, produce a 5 x 3 tibble that has the variables playerID, yearID, and a variable that represents the max number of homeruns hit by Barry Bond. Note, Barry Bond’s playerID is bondsba01. This tibble should be in decending order by max number of homeruns. For more information on the data set, including the variable names and their descriptions, please access the help file using ?Batting in the console.
Batting |>
  select(playerID, yearID, HR) |>
  filter(playerID == "bondsba01") |>
  arrange(desc(HR)) |>
  slice(1:5)
playerID yearID HR
1 bondsba01 2001 73
2 bondsba01 2000 49
3 bondsba01 1993 46
4 bondsba01 2002 46
5 bondsba01 2003 45Using the Batting data set, in a single pipeline, calculate how many players (observations) there are for the baseball team, the Atlana Braves, in the year 2000. Your answer should be a 1 x 3 tibble that displays the correct teamID, correct yearID, and the correct number of observations. Note, the teamID for the Atlata Braves is ATL.
Question 4
Batting |>
  filter(G > 150) |>
  mutate(era = if_else(yearID <= 1950, "Pre1951" ,"Post1951")) |>
  ggplot(
    aes(x = yearID, y = R, color = era)
  ) +
  geom_point() +
  geom_smooth(aes(group=era), method=lm, color = "black" , se = F) +
  labs(title = "Play Ball!",
       subtitle = "Plot of Year by Runs for players who played \nat
       least 150 games during the season",
        y = "Runs" ,
        x = "Year",
        caption = "Sean Lahman Baseball Database") +
  theme(legend.position = "none") +
  geom_vline(xintercept = 1950, linetype = "dashed") +
  geom_text(label = "The Year 1950", x = 1950 + 13, y = 160, col = "black",
            size = 4)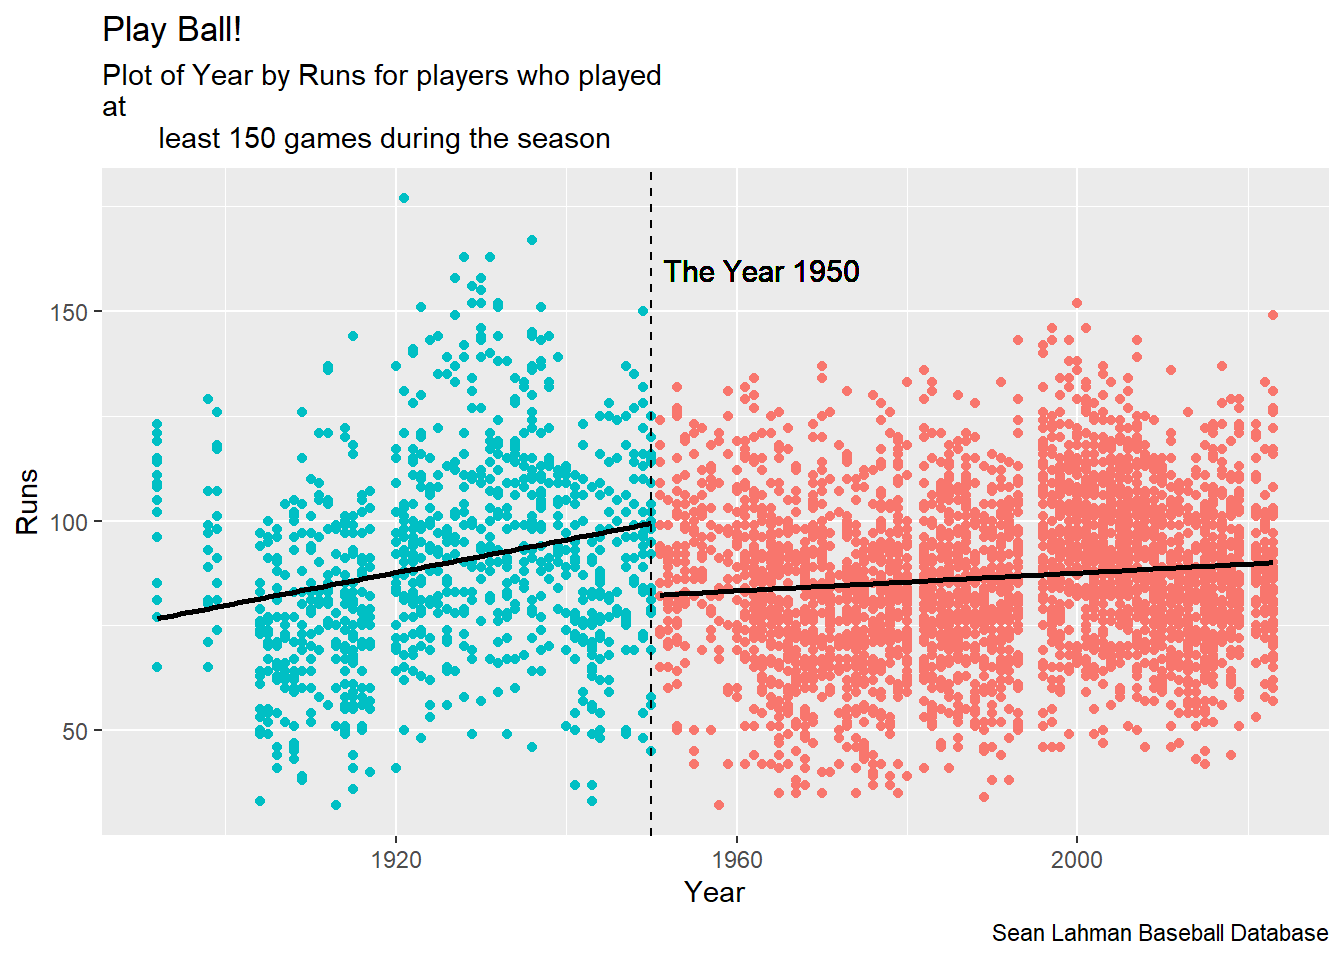
It looks like Runs increased from the year 1871 to 1950 at a faster rate than from 1951 to 2022.
Question 5
What’s going on here? Explain what….
There are multiple combinations of species and island. That is, bill length is not uniquely identified.
“
<dbl [52]>: This means there are 52 bill lengths for the Gentoo Torgersen combination. They are stored in a list as the data type double.
and “” means: a list can be used to store elements of different types in the same vector. This is a place to store multiple elements
Please use https://r4ds.hadley.nz/rectangling.html#list-columns as a resource to answer this question!
Question 6
penguins |>
  group_by(species, island) |>
  summarise(n = n()) |>
  pivot_wider(names_from = island,
              values_from = n ) |>
  mutate(Biscoe = if_else(is.na(Biscoe), 0, Biscoe),
         Dream = if_else(is.na(Dream), 0, Dream),
         Torgersen = if_else(is.na(Torgersen), 0, Torgersen))
`summarise()` has grouped output by 'species'. You can override using the
`.groups` argument.# A tibble: 3 × 4
# Groups: species [3]
species Biscoe Dream Torgersen
<fct> <dbl> <dbl> <dbl>
1 Adelie 44 56 52
2 Chinstrap 0 68 0
3 Gentoo 124 0 0Question 7
There are two NA values for bill length in the penguins data set. It just so happens that I know what the missing values are! The missing values for the Adelie species is 26, and the missing value for the Gentoo species is 30. In a single pipeline, replace the NA values in the bill length column with their appropriate value, and print out the first 10 rows of the tibble arranged in accending order to show that you have correctly filled in the NA values. Note: you do not need to fill in the NA values for any other column besides bill length.
penguins |>
  mutate(bill_length_mm = case_when(
    species == "Adelie" & is.na(bill_length_mm) ~ 26,
    species == "Gentoo" & is.na(bill_length_mm) ~ 30,
    TRUE ~ bill_length_mm
  )) |>
  arrange(bill_length_mm)
# A tibble: 344 × 8
species island bill_length_mm bill_depth_mm flipper_length_mm body_mass_g
<fct> <fct> <dbl> <dbl> <int> <int>
1 Adelie Torgersen 26 NA NA NA
2 Gentoo Biscoe 30 NA NA NA
3 Adelie Dream 32.1 15.5 188 3050
4 Adelie Dream 33.1 16.1 178 2900
5 Adelie Torgersen 33.5 19 190 3600
6 Adelie Dream 34 17.1 185 3400
7 Adelie Torgersen 34.1 18.1 193 3475
8 Adelie Torgersen 34.4 18.4 184 3325
9 Adelie Biscoe 34.5 18.1 187 2900
10 Adelie Torgersen 34.6 21.1 198 4400
# ℹ 334 more rows
# ℹ 2 more variables: sex <fct>, year <int>