fact<-'Real R code!'
#With a comment!
print('And its output looks like this!')
[1] "And its output looks like this!"Guided walkthroughs serve as a reference and review for the week’s material. A walkthrough will be available for every week starting with Week 2. These walkthroughs will go through the material covered in the videos, offering additional worked examples and debugging suggestions.
This document will feature text, coding examples, and corresponding output (see below)
fact<-'Real R code!'
#With a comment!
print('And its output looks like this!')[1] "And its output looks like this!"Reading the assigned walkthroughs will help best ensure your success in the course. You are encouraged to re-reference a week’s walkthrough whenever you encounter errors or the material is confusing! If you find the topics explored here fascinating, please come to my office hours so we can discuss topics in even greater detail.
First, let’s have a look around Posit Workbench. To access Posit Workbench, go to https://rstudio.stat.ncsu.edu/ and log-in with your NCSU email and password. Posit used to be RStudio but then rebranding happened. Just like Meta/Facebook and X/Twitter, I will keep stubbornly referring to it by the common name (RStudio) and getting confused by any attempts to do otherwise.
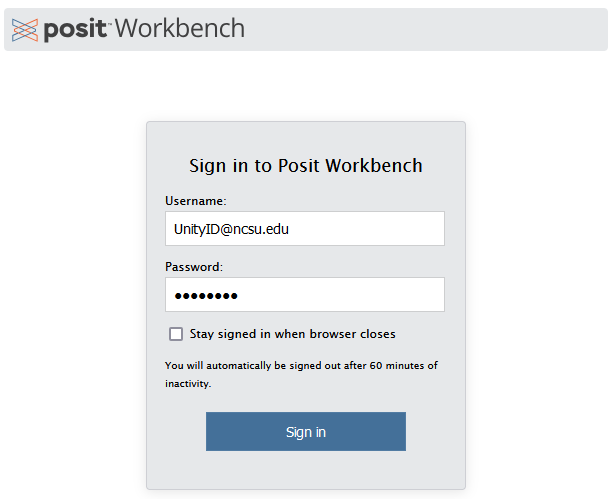
Your browser window should now look something like the below.

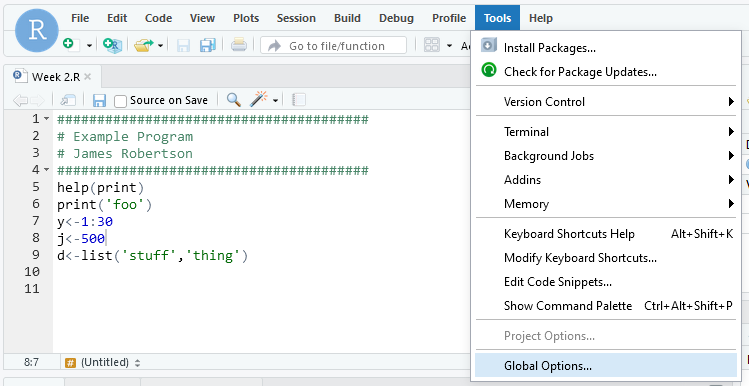
As a first step, let’s change the appearance, or “theme”, of RStudio to better fit your preferences. Everything in RStudio is colored to communicate something. Text may be black, blue, green, and other colors by default, which may pose a problem due to color-blindness, distaste for that precise shade of green, or a host of other reasons. Personally, I sometimes find in my advanced age that the stark white of the console is fatiguing in low-light conditions so I tend to change the theme through the day.
To change the theme, first click Tools and then select Global Options….
There are a lot of themes to choose from, so I suggest shopping around! You can change it any time so if a theme isn’t working out, you can always go back and change it later. For a high-contrast dark theme, I tend to like Merbivore Soft (especially in October), but it is entirely personal preference.
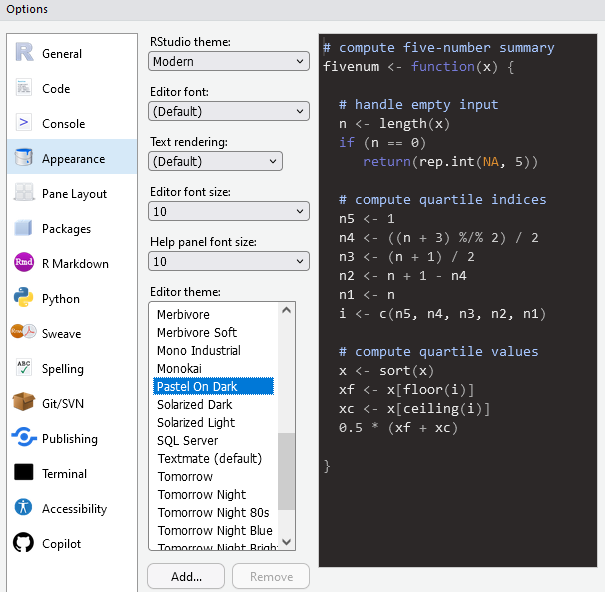
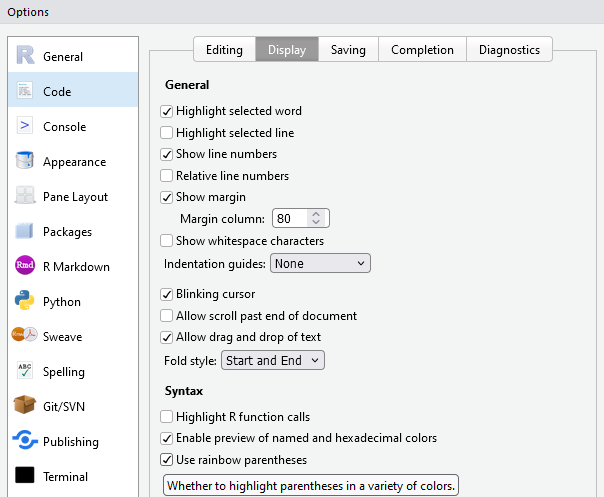
Before you close out of this options window, there is one other thing I suggest you do. Go now to Code on the left side and then select Display from the tabs along the top. Down at the bottom is an option for “Use rainbow parentheses” which I suggest you check. Matching parentheses (making sure there are the same number of left and right parentheses)) can be a real pain! When you’re nesting functions, it can be easy to lose track of which parentheses match which others and using rainbow parentheses can make that easier. This will make it so that every pair of parentheses is matched in color, which will be very valuable later!
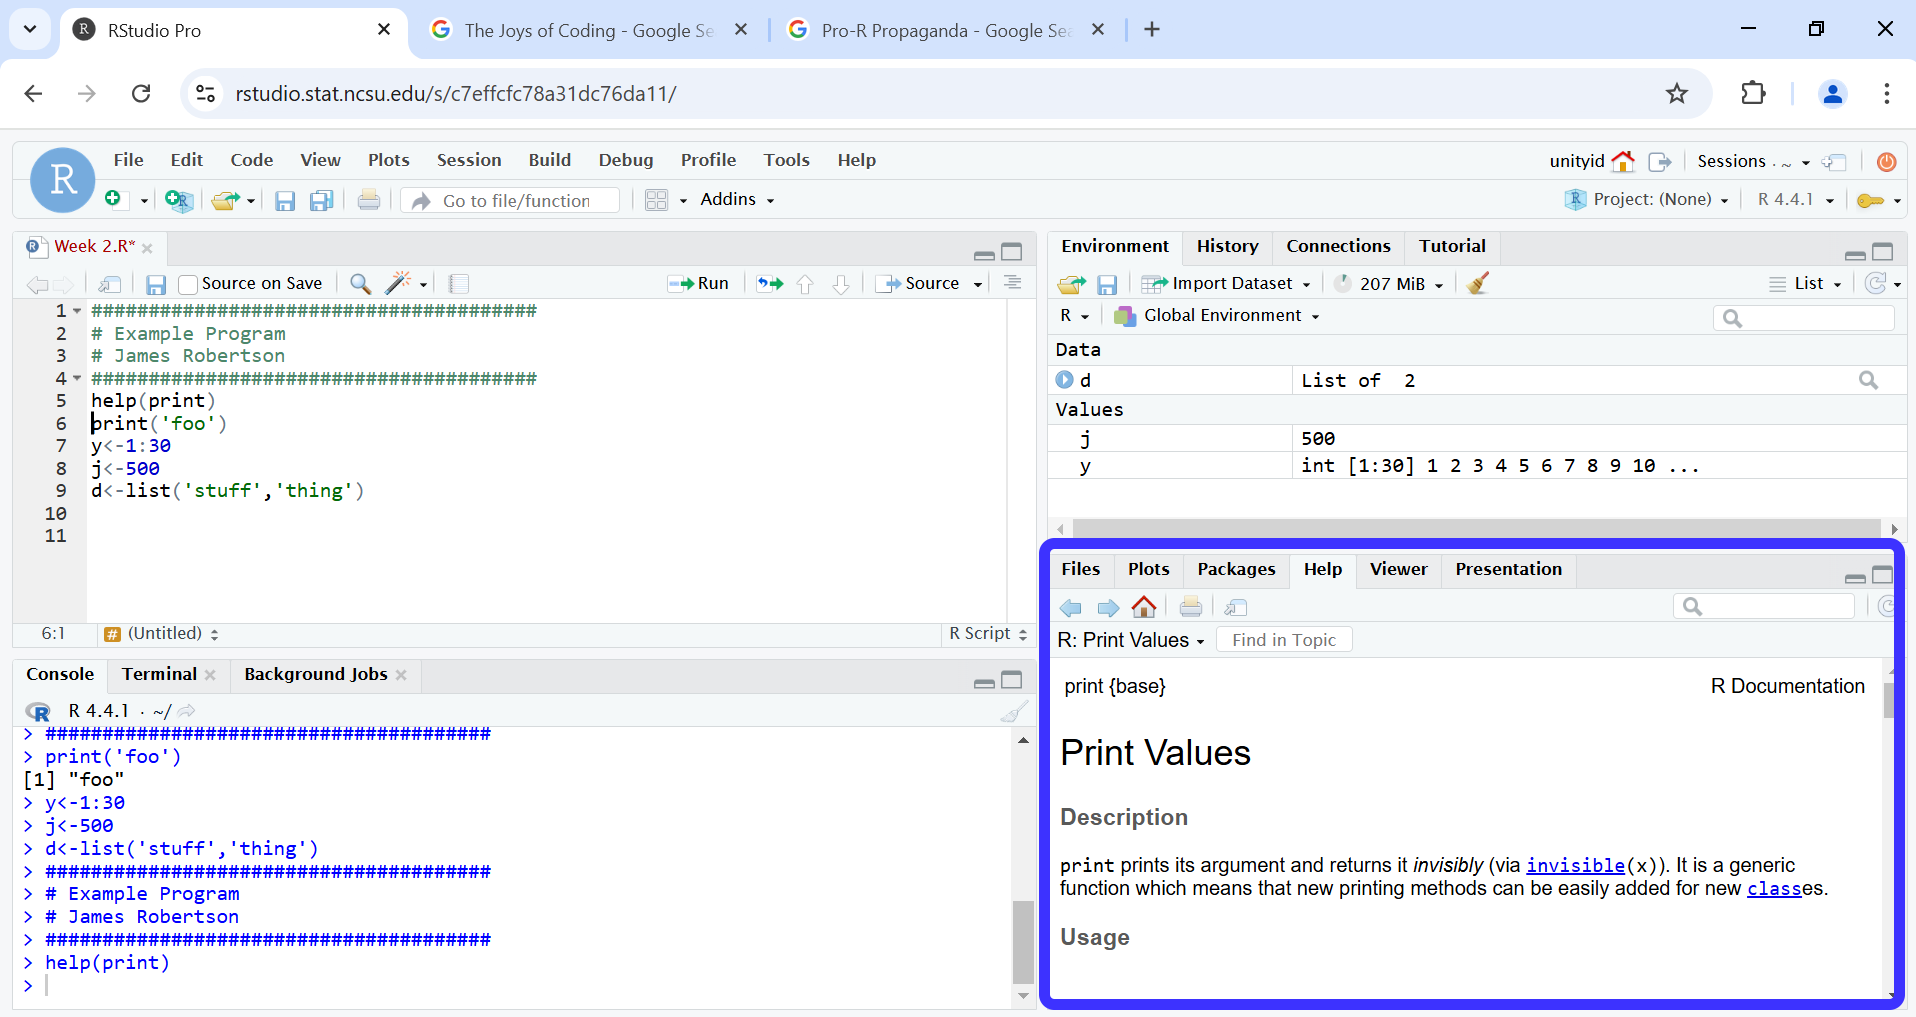
Oh hey, I didn’t see you there. You must be new here, I don’t think we’ve met. My name is James, I’m the man behind the scenes and am responsible for putting together these walkthroughs. Since you’re new to R and RStudio, why don’t I give you a tour of the place?
Let’s start with the Console, down in the bottom left of your screen. The Console is where code is run. Generally we don’t write much code here, it’s a kind of back-of-the-napkin thing. When I’m testing code or doing a quick calculation, I’ll type it in here and hit Enter to submit the code, but otherwise most code gets written in the Scripting Window. You can also see here what code has been executed previously!

In the top left is the Scripting Window where we’ll spend most of our time. Here is where we write any code we want to have access to later. We usually start with a header (those first 4 green lines) just to say what the file is and who wrote it. A more detailed example of a header is provided on your course page under R File Submission Guidelines. Note that my header would not be sufficient as there is no date! While this is an intentional choice on my part to give the script a timeless feel, you should always date your work (and be astonished by how time flies).
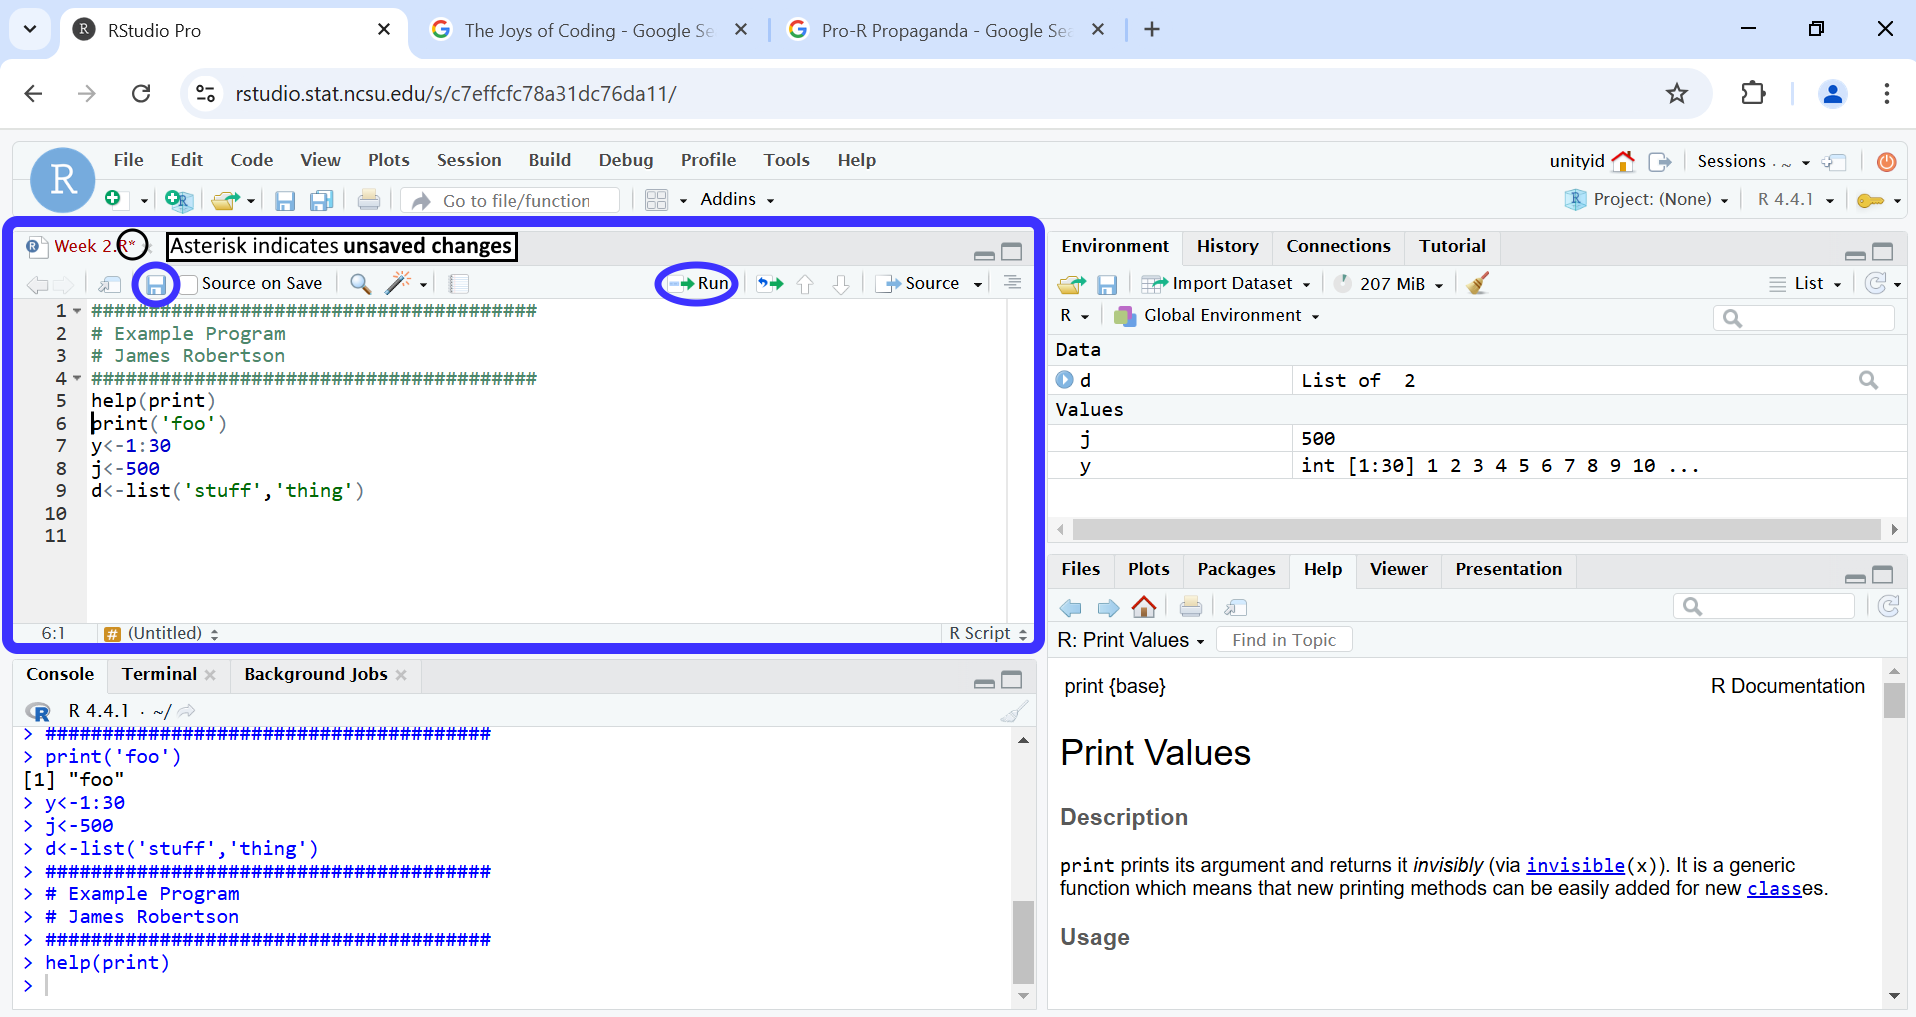
Along the top of the Scripting Window are the code files (scripts) you have open. Notice that right now “Week 2.R*” is red! The red color and the presence of the asterisk (*) indicate there are unsaved changes in my script! Hitting Ctrl + S (or CMD + S) will save your work or you can hit the floppy disk icon just below the tabs.
When working in the Scripting Window, you can easily send code to be evaluated in the Console by clicking and dragging with your mouse to highlight a line or lines you want to run and hitting Ctrl + Enter (or CMD + Enter) or by clicking the Run icon below the tabs. If you want to run just one line, you don’t even have to highlight it! You can simply click on the appropriate line to get your cursor there and then hit Ctrl + Enter (or CMD + Enter) as usual. Please do not copy and paste code into the Console, save your time and effort!
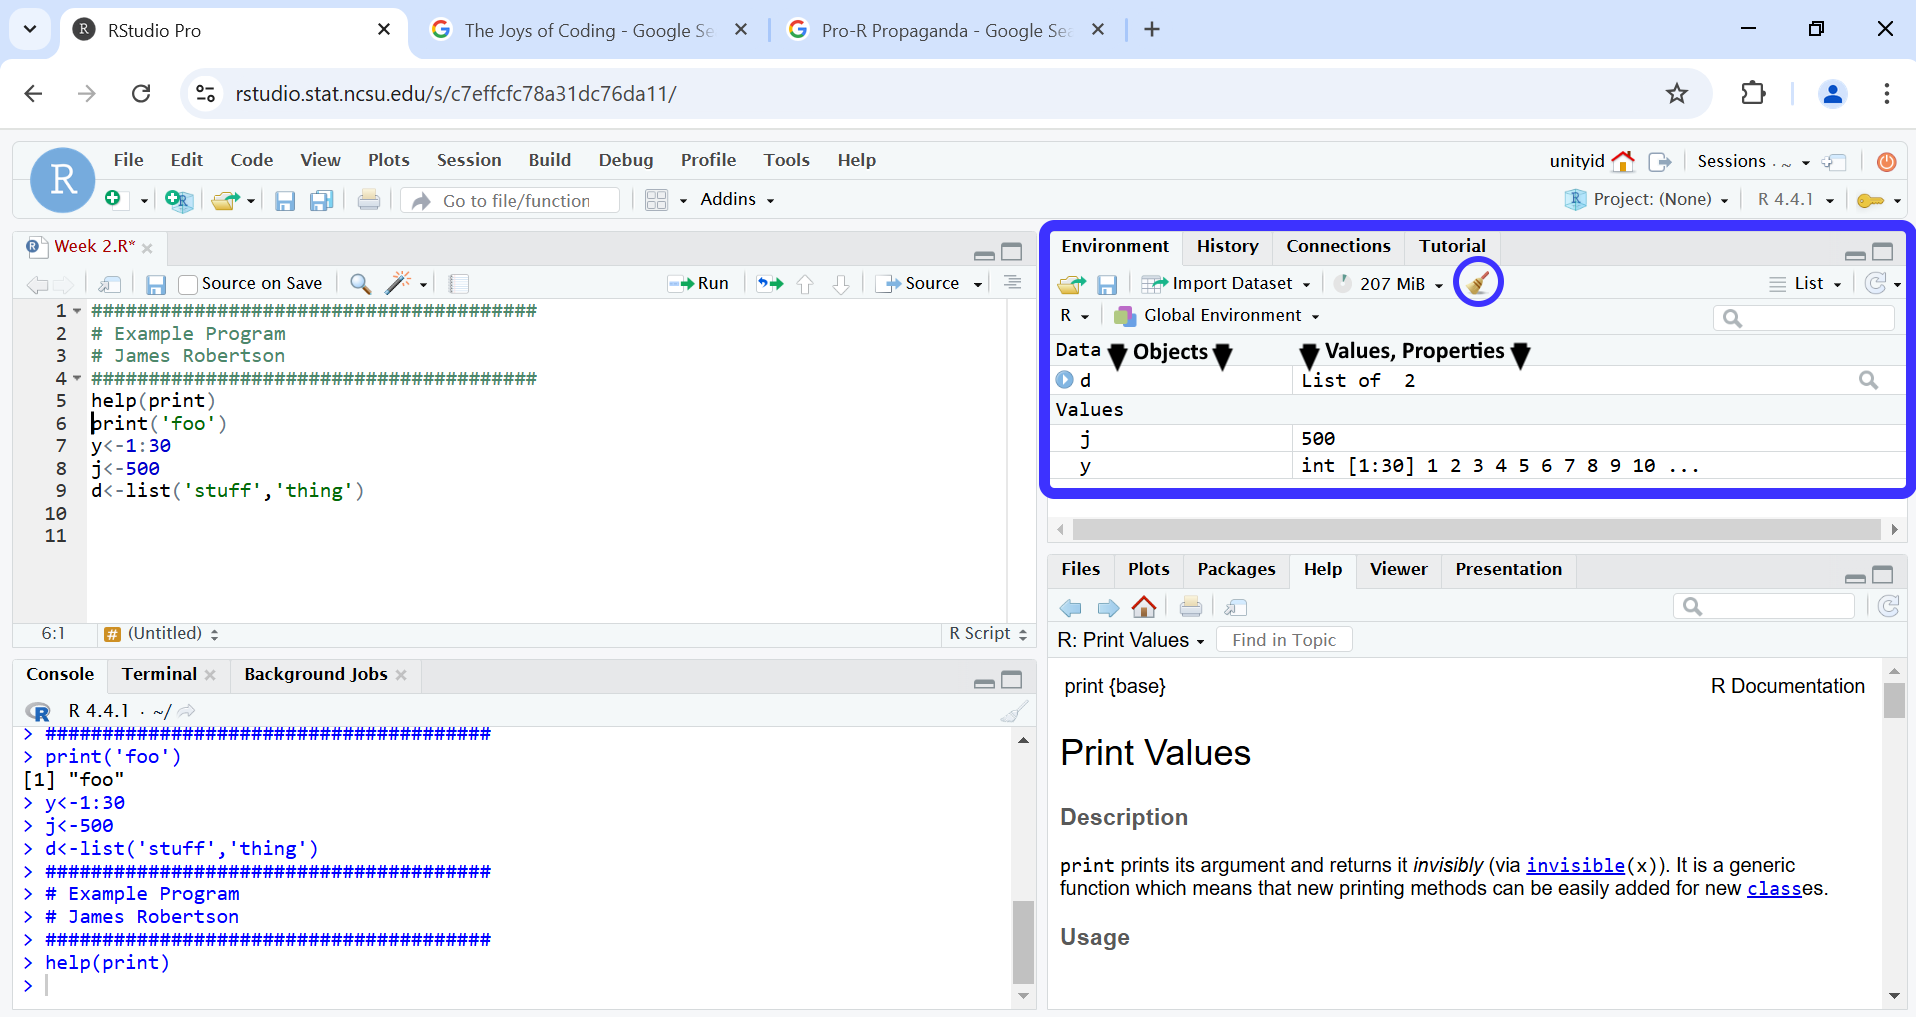
After running code, you will often find that you have made objects. You will then also find that you don’t remember which objects have and have not been made! This is where the Environment pane, in the top-right, comes into play. Here are now listed all the objects you have generated along with their values and properties (one may even say their Structure). In the left column are the objects listed by name (with a drop-down arrow when their structure is complicated) and the right column lists their values and properties, shown as they may appear if you were to use str() on the object (more on this later)!
Notice the small broom icon in the middle just below the tabs. This broom is very important! Clicking this icon will sweep away all your objects into the dustbin of history, never to be seen or heard from again. While this may sound overdramatic, it is! Whenever you are encountering strange errors, clicking the broom and rerunning your code completely won’t always sweep your problems away, but it can sometimes make it clear where the error was coming from. When getting unexpected values and behavior, try doing a little cleaning up first!
In the bottom right is the Et Cetera pain (so named by me, right now). Formally it is referred to as “Files, Packages, Help, Etc.” but Et Cetera just has such a ring to it. Here is where a hodge-podge of things all find their home. Looking at the tabs of this pane, you can see this hodge-podge yourself! In the Files tab it shows the files in your current working directory (effectively what files are located where your script is). There is also the Packages tab which lists every package installed and is generally not worth looking at unless you like long lists. The things you will actually use this window for are the Plots and Help tabs.
The Plots tab is where any plots or graphs you generate will appear. There are left and right arrows to cycle through the various plots generated. Pretty straightforward.
The Help tab is arguable the most important and where my eyes have spent many loving hours. The Help tab gives you access to all of R’s internal documentation. If you aren’t sure how a particular function works, you can search for it in the top-right search bar or typing into your Console something like help(print) or ?print, where print can be replaced with any function or object of interest. The documentation can be pretty jargon-y, but over time you may get used to it. There are also often examples of how to use functions at the end of their help page!